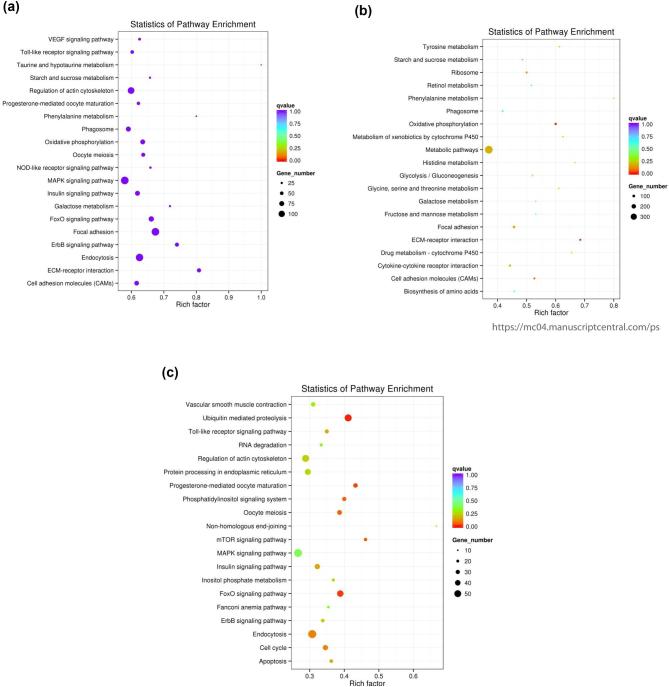
Figure 4.
KEGG enrichment scattered plot for embryonic days 16 and 19 bursal cells from Hy-Line W-36 embryos. (a) DEG-enriched KEGG pathway scatterplot. (b) Upregulated DEG-enriched KEGG pathway scatterplot. (c) Downregulated DEG-enriched KEGG pathway scatterplot. The KEGG enrichment scatter plot: the most significant enriched 20 pathways are presented in the scatter plot. (a) The scattered plot of all DEGs: x-axis represents the name of the pathway and the y-axis represents the rich factor. The size stands for the number of difference genes and the color stands for different Q-values. (b) The scattered plot of upregulated DEGs: x-axis represents the name of the pathway and the y-axis represents the rich factor. The size stands for the number of difference genes and the color stands for different Q-values. (c) The scattered plot of downregulated DEGs: x-axis represents the name of the pathway and the y-axis represents the rich factor. The size stands for the number of difference genes and the color stands for different Q-values.

