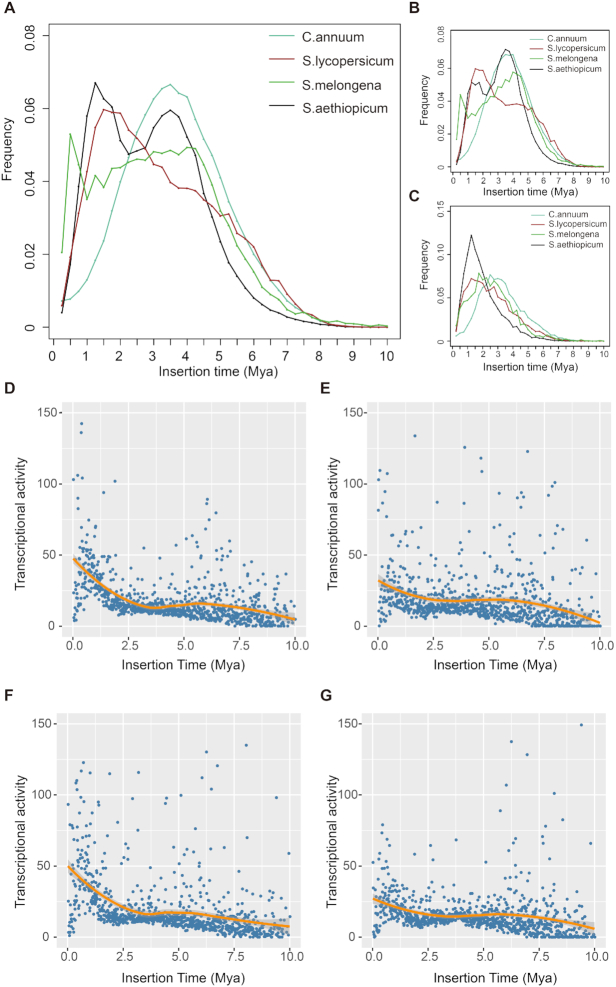
Figure 2:
Long terminal repeat retrotransposon (LTR-R) insertion time distribution and the expression level of LTR-Rs in different tissues. Insertion time distribution of total LTR-Rs (A), Ty3/Gypsy LTR-Rs (B), and Ty1/Copia LTR-Rs (C) of Capsicum annuum, Solanum melongena, S. lycopersicum, and S. aethiopicum. The x- and y-axes, respectively, indicate the insertion time and the frequency of inserted LTR-Rs. Expression levels of LTR-Rs in flower (D), fruit (E), leaf (F), and root (G) tissues.

