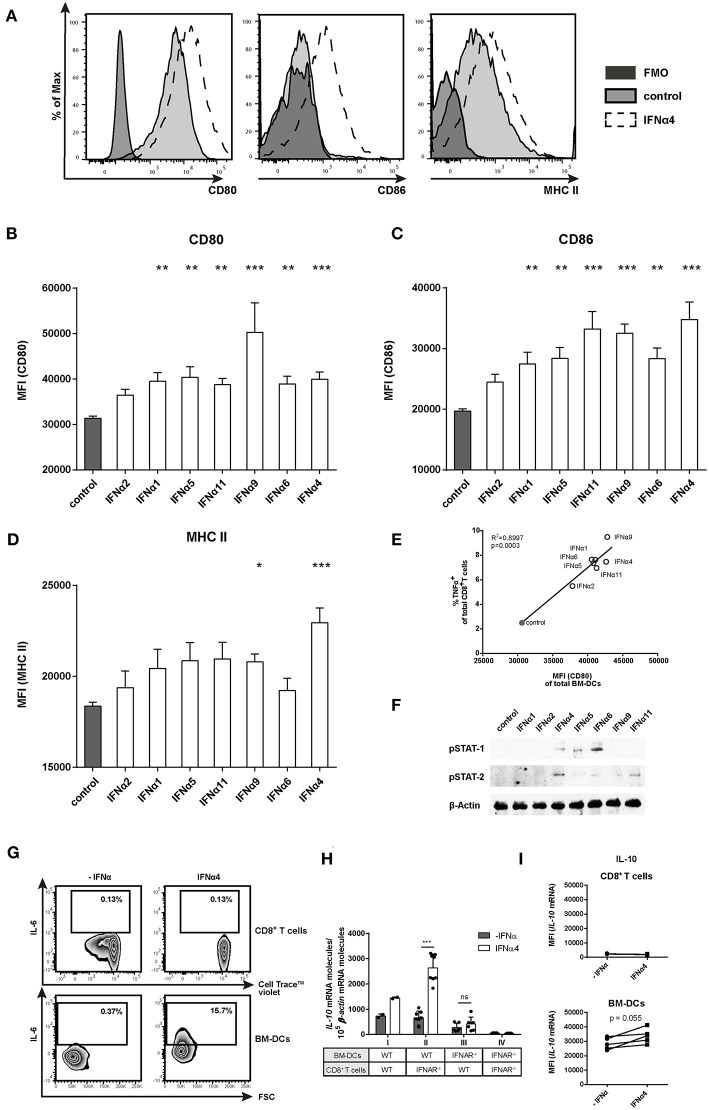
Figure 4.
Phenotypic analysis of IFNα subtype-stimulated BM-DCs. Positively enriched Cell TraceTM Violet-labeled CD8+ T cells from FV-specific TCRtg mice were co-cultured with FV peptide-loaded BM-DCs in the presence or absence of different murine IFNα subtypes for 72 h (500 units/well). For phenotypic characterization, BM-DCs (CD11b+ CD11c+) were analyzed by flow cytometry using anti-CD80, anti-CD86, anti-MHC class II, and anti-IL-6 antibodies. (A) Representative histograms of unstimulated or IFNα subtype-stimulated BM-DCs and FMOs are shown. Mean expression indicated by MFI for (B) CD80, (C) CD86, and (D) MHC II are shown. Mean values (+SEM) are indicated by bars. The IFNα subtypes were sorted in the order of their antiproliferative potency (n ≥ 9). (E) A Pearson correlation test was used to show the correlation of the MFI of CD80-expressing peptide-loaded BM-DCs with the percentages of TNFα-expressing CD8+ T cells. Mean values of the different groups are shown as open circles (IFNα subtype-treated) or closed circle (untreated) (n = 5). (F) Western Blot analysis of BM-DCs stimulated for 15 min with 500 units of different IFNα subtypes. Antibodies against phosphorylated STAT-1 and STAT-2 and the loading control β-Actin were used as indicated. (G) Multi-parametric flow cytometry was used to determine intracellular IL-6 expression in CD8+ T cells and peptide-loaded BM-DCs. Representative dot plots of untreated and IFNα4-treated co-cultures are shown. (H) Positively enriched CD8+ T cells from FV-specific TCRtg (WT) or IFNAR−/− TCRtg (IFNAR−/−) mice were co-cultured with FV peptide-loaded WT or IFNAR−/− BM-DCs in the presence or absence of IFNα4 for 24 h (500 units/well). IL-10 mRNA expression was analyzed by RT-PCR. (I) Intracellular IL-10 mRNA expression in CD8+ T cells and BM-DCs was determined after 24 h of co-culture by PrimeFlow RNA™ Assay and was analyzed by flow cytometry. Individual MFI of untreated and IFNα4 treated co-cultures are shown by symbols and connecting lines. (B–D,H) Statistically significant differences between the IFNα-treated groups and the untreated group were tested using Kruskal-Wallis one-way or Ordinary One Way ANOVA analysis and Dunn's multiple comparison and are indicated by * for p < 0.05; ** for p < 0.01; *** for p < 0.001.

