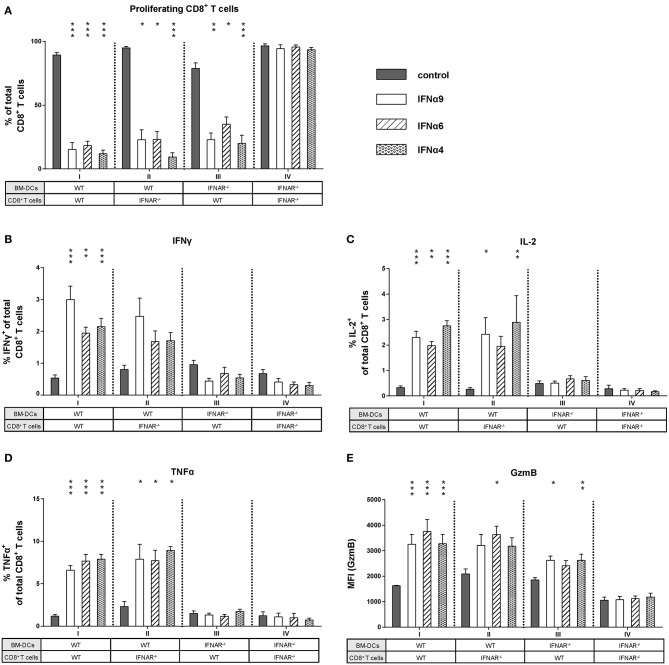
Figure 5.
Influence of IFNAR expression on the proliferation and intracellular cytokine expression of IFNα subtype-stimulated CD8+ T cells. Positively enriched Cell TraceTM Violet-labeled CD8+ T cells from FV-specific TCRtg (WT) or IFNAR−/− TCRtg (IFNAR−/−) mice were co-cultured with FV peptide-loaded WT or IFNAR−/− BM-DCs in the presence or absence of IFNα4, IFNα6, or IFNα9 for 72 h (500 units/well). (A) CD8+ T cell proliferation was measured as loss of cell tracer dye by flow cytometry and mean percentages (+SEM) of proliferating CD8+ T cells are shown as bars (n ≥ 6). Multi-parametric flow cytometry was used to determine percentages of intracellular expression of (B) IFNγ, (C) IL-2, (D) TNFα, and (E) MFI of intracellular GzmB expression in CD8+ T cells. Mean values (+SEM) are indicated by bars and are sorted in antiproliferative order (n ≥ 6). Statistically significant differences between the IFNα-treated groups and the untreated group within one approach (I–IV) were tested using Kruskal-Wallis one-way or Ordinary One Way ANOVA analysis and Dunn's multiple comparison and are indicated by * for p < 0.05; ** for p < 0.01; *** for p < 0.001.

