Figure 1.

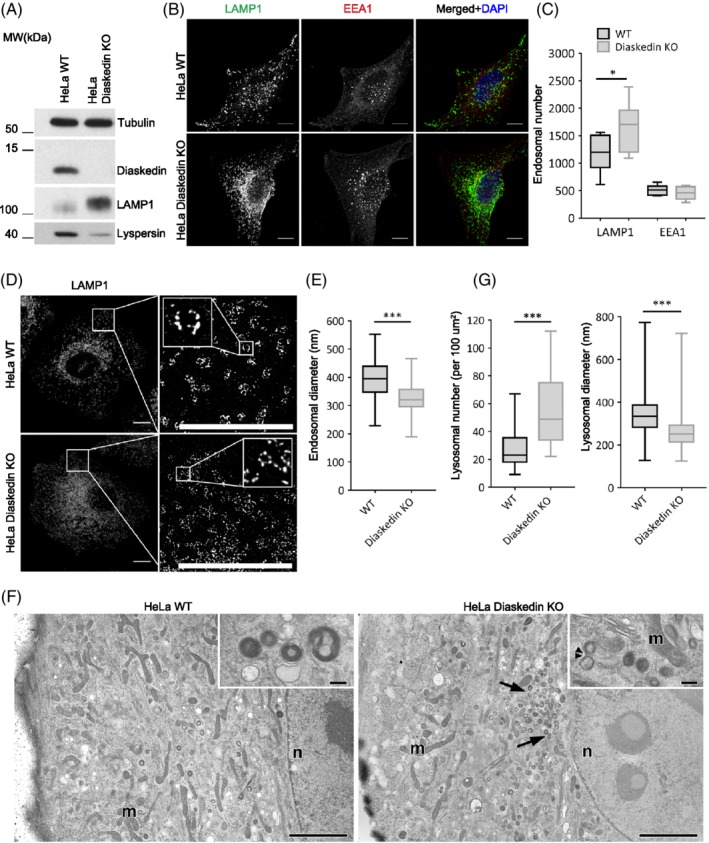
Deletion of Diaskedin causes reduction of late endosomal size in HeLa. (A) WB of cell lysates of HeLa WT and Diaskedin KO cells. (B) Single plane images of Z‐stacks of WT HeLa and Diaskedin KO, stained with the late endosomal marker LAMP1 and the early endosomal marker EEA1. Scale bars: 10 μm. (C) Frequency of endosomes in WT and Diaskedin KO HeLa based on analyses of Z‐stack confocal images. Total endosomal count was acquired using automated counting algorithm in Imaris from 10 cells per genotype. Data presented as median value with the box representing the 25th and 75th percentile, and the whiskers—the minimal and maximal values. Unpaired Student's t test was performed between WT and KO samples for each endosomal population (*P ≤ .05; **P ≤ .01; ***P ≤ .001). (D) Super resolution STED images of WT HeLa and Diaskedin KO. Inserts show magnification of the selected areas. Scale bars: 10um. (E) Endosomal diameters in WT and Diaskedin KO HeLa based on measurements from superresolution STED images. Manual size measurement of at least 100 endosomes from at least six cells per genotype was made. Data presented as median value with the box representing the 25th and 75th percentile, and the whiskers—the minimal and maximal values. Unpaired Student's t test was performed between WT and KO samples (*P ≤ .05; **P ≤ .01; ***P ≤ .001). (F) Electron microscopy (EM) of cryofixed HeLa WT and Diaskedin KO cells with perinuclear clustering of lysosomes (arrows) in Diaskedin KO cells (m: mitochondria, n: nucleus). Scale bars: 2 μm. Inserts show high magnification views of lysosomes, one of which with a putative constriction site (double arrow‐head) in KO cells. Scale bars: 200 nm. (G) Frequency of lysosomes per 100 square‐micron cytoplasm and lysosomal size in WT and Diaskedin KO HeLa cells as measured on EM images (>550 lysosomes from >25 cells per genotype). Data presented as median value with the box representing the 25th and 75th percentile, and the whiskers—the minimal and maximal values. Unpaired Student's t test was performed between WT and KO (*P ≤ .05; **P ≤ .01; ***P ≤ .001)
