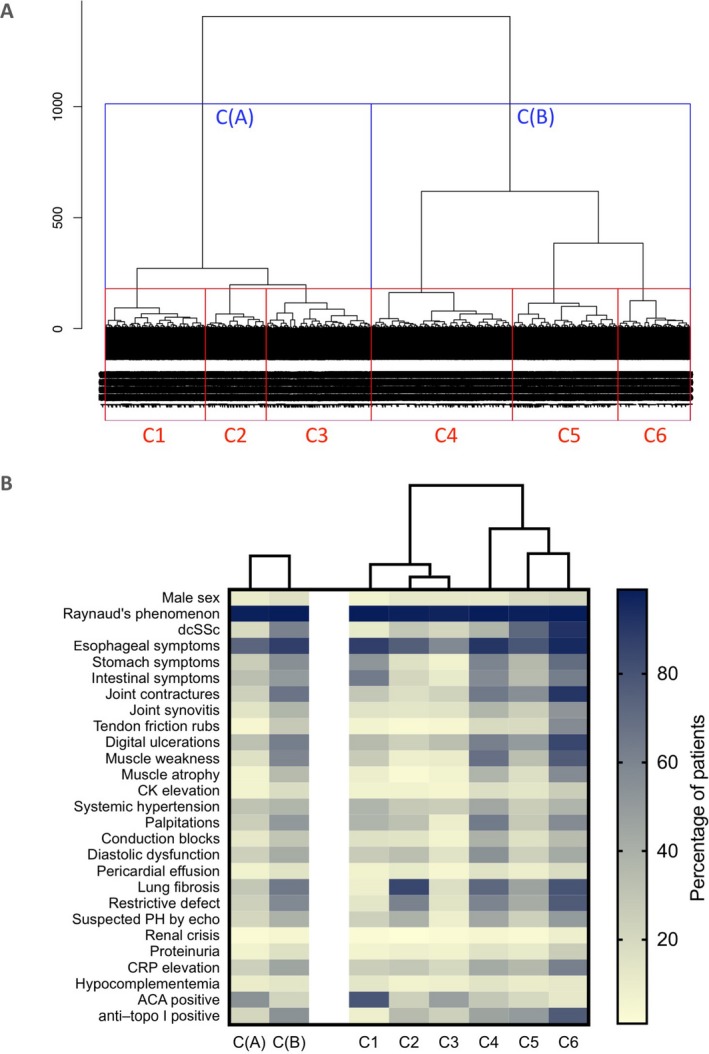
Figure 1.

A, Dendrogram of the 6,927 patients with systemic sclerosis (SSc) included in the cluster analysis. The length of the vertical lines represents the degree of similarity between patients. Patients were divided into 2 clusters (cluster A and B) and into 6 clusters (clusters 1–6). B, Heatmap showing the clinical characteristics in each cluster. dcSSc = diffuse cutaneous SSc; CK = creatine kinase; PH = pulmonary hypertension; CRP = C‐reactive protein; ACA = anticentromere antibody; anti–topo I = anti–topoisomerase I.
