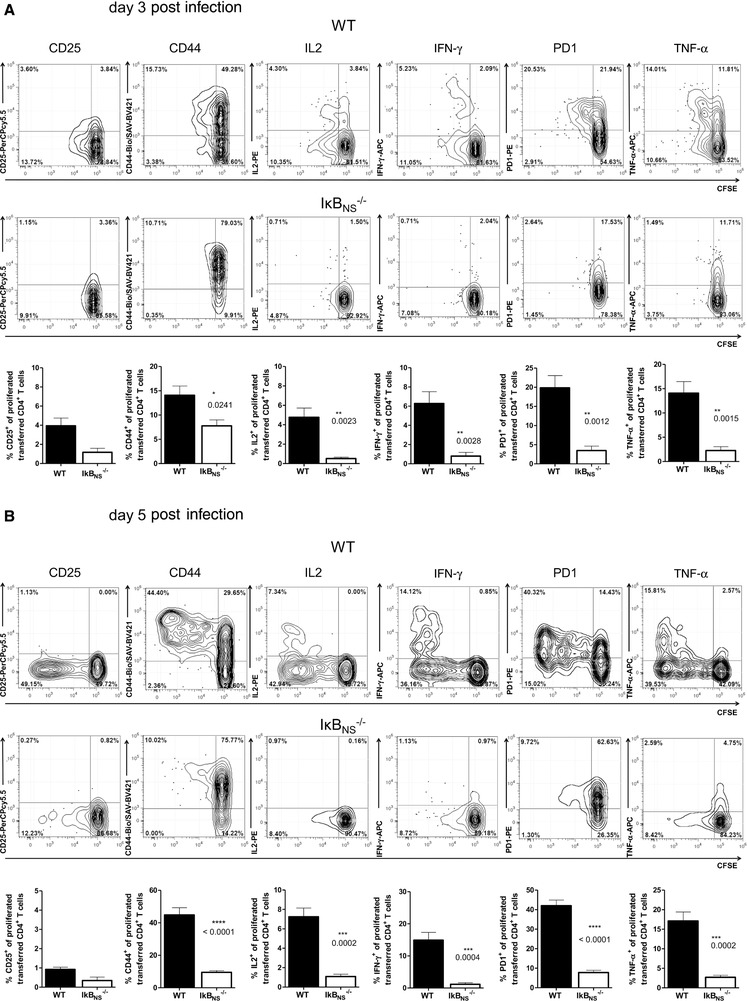
Figure 2.

Phenotype of adoptively transferred LM‐OVA‐specific CD4+ T cells after LM‐OVA infection. Adoptive transfer of WT and IκBNS −/− OT‐II CD4+ T cells was performed as described in Figure 1. (A) 3 and (B) 5 days post LM‐OVA infection splenic lymphocytes were analyzed by flow cytometry. Flow cytometry analysis was constrained to alive singlet Thy1.1+CD4+ T cells. Data are depicted as mean +/− SEM (n = 4–5 individually analyzed mice/group) from two (day 3) or three (day 5) independent experiments with similar outcome. Upper rows: representative contour plots with 5% probability with outliers for CD25, CD44, IFN‐γ, IL‐2, PD‐1, and TNF‐α versus CFSE from OT‐II CD4+ T cells. Lower rows: summary plots indicate percentages of marker‐positive T cells within the CFSElow fraction. Statistics were performed using two‐tailed unpaired student‘s t‐test. *p < 0.05, **p < 0.01, ***p < 0.001.
