
Figure 2.
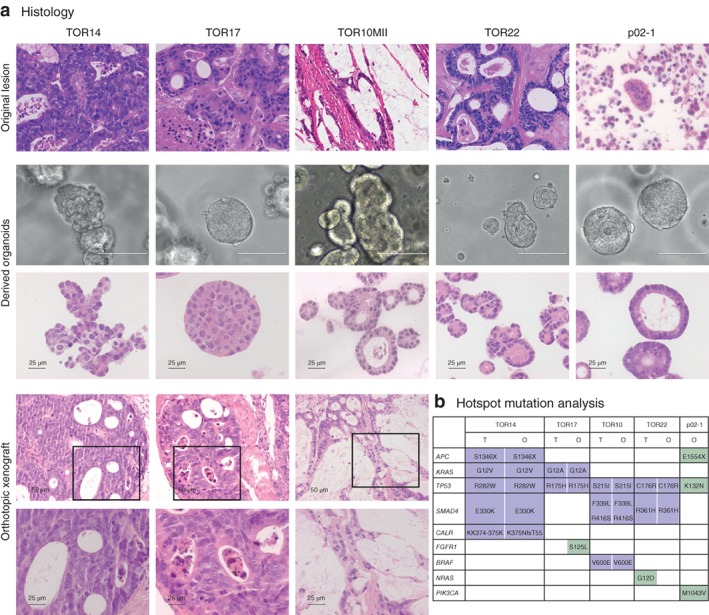
Morphological and molecular comparison of organoids of peritoneal metastases with parent tumours from which they were derived a Histological or cytological (p02‐1) comparison of parent tumours (haematoxylin and eosin stain; TOR14, TOR17, TOR22 and p02‐1: original magnification × 40; TOR10: original magnification × 20) with matched organoids (bright field, scale bar 100 μm; haematoxylin and eosin stain, scale bar 25 μm) and orthotopic xenografts in mouse caecum (haematoxylin and eosin stain, original magnification × 10 and × 40). b Comparison of hotspot mutations in original tumours (T) and matched organoids (O). The tumour cell content of solid peritoneal lesions of p02‐1 was too low (less than 5 per cent) to call mutations reliably.