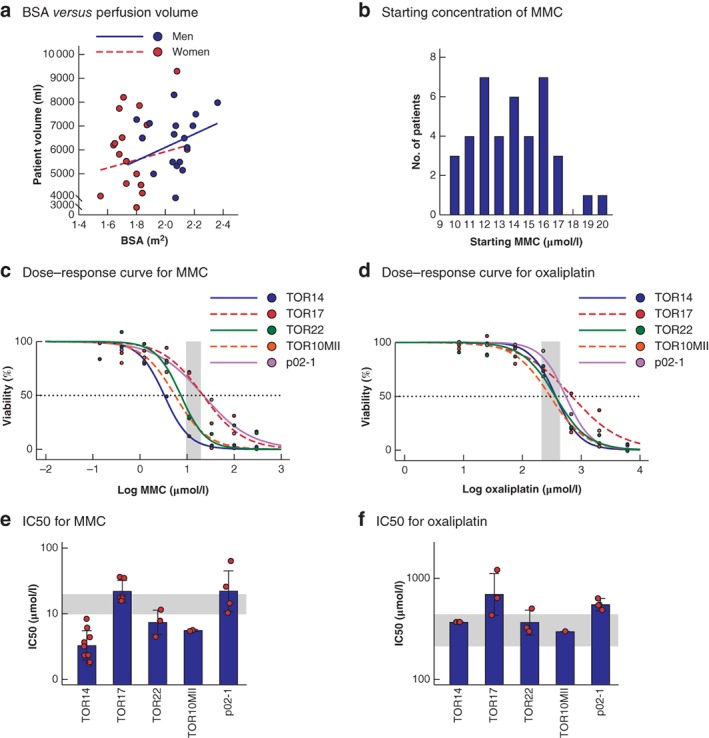
Figure 3.

Organoids as an in vitro model to study the efficacy of hyperthermic intraperitoneal chemotherapy regimens a Scatter plot of body surface area (BSA) versus intra‐abdominal perfusion volume, which together determine the concentration of hyperthermic intraperitoneal chemotherapy (HIPEC) drug in the clinic (men: R 2 = 0·019, P = 0·540; women: R 2 = 0·119, P = 0·161). b Frequency distribution histogram of calculated starting concentrations of mitomycin C (MMC) in 40 HIPEC procedures. c,d Dose–response curves illustrating the variation in sensitivity to MMC (c) and oxaliplatin (d) on the individual patient‐derived organoids. The shaded area represents the clinically relevant concentration ranges determined in the clinical cohort. The dashed line crosses the individual curves at the concentration required to eliminate 50 per cent of the tumour cells (IC50). e,f Estimated between‐batch variation (variation between separate in vitro HIPEC experiments) for MMC (e) and oxaliplatin (f). Bars represent the estimated IC50 values pooled over all batches using a non‐linear mixed‐effect model as determined in c and d; error bars show estimated standard deviation in IC50 values between batches, and symbols indicate estimated per‐batch IC50 values (both based on random batch effects included in the model). The shaded area represents the clinically relevant concentration ranges determined in the clinical cohort.
