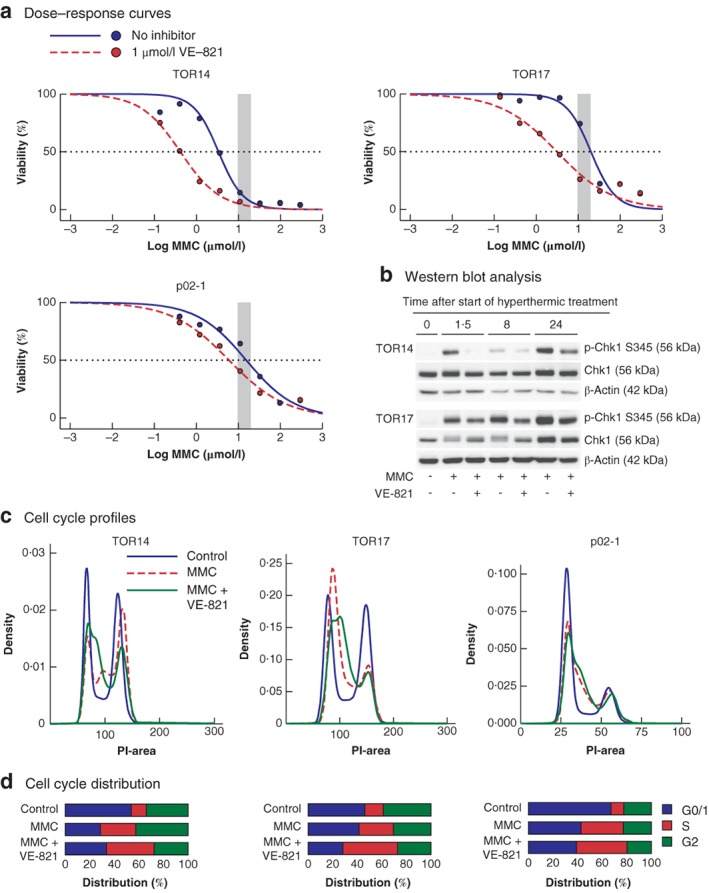
Figure 4.

Effects of mitomycin C and ATR inhibition on organoid viability and cell cycle distribution a Dose–response curves comparing mitomycin C (MMC) monotherapy and the combination of MMC and ATR inhibitor VE‐821 in the individual organoids. The shaded area represents the clinically relevant concentration ranges determined in the clinical cohort. The dashed line crosses the individual curves at the concentration required to eliminate 50 per cent of the tumour cells. b Western blot analysis of checkpoint kinase 1 (Chk1) phosphorylation over time, following 90 min of treatment with hyperthermic MMC or a combination of MMC and VE‐821; p‐Chk1 S345, Chk1 phosphorylated on serine 345. c Cell cycle profiles of the different organoids 24 h after treatment (90 min at 42°C) with either no drugs (control), MMC (TOR14, 3 μmol/l; TOR17, 20 μmol/l; p02‐1, 24 μmol/l), or MMC followed by 24 h of treatment with 1 μmol/l VE‐821. The DNA content of individual cells was measured by propidium iodide (PI) intensity. d Quantification of cell cycle distribution. Data for TOR22 and TOR10MII are shown in Fig. S2 (supporting information).
