Figure 5.

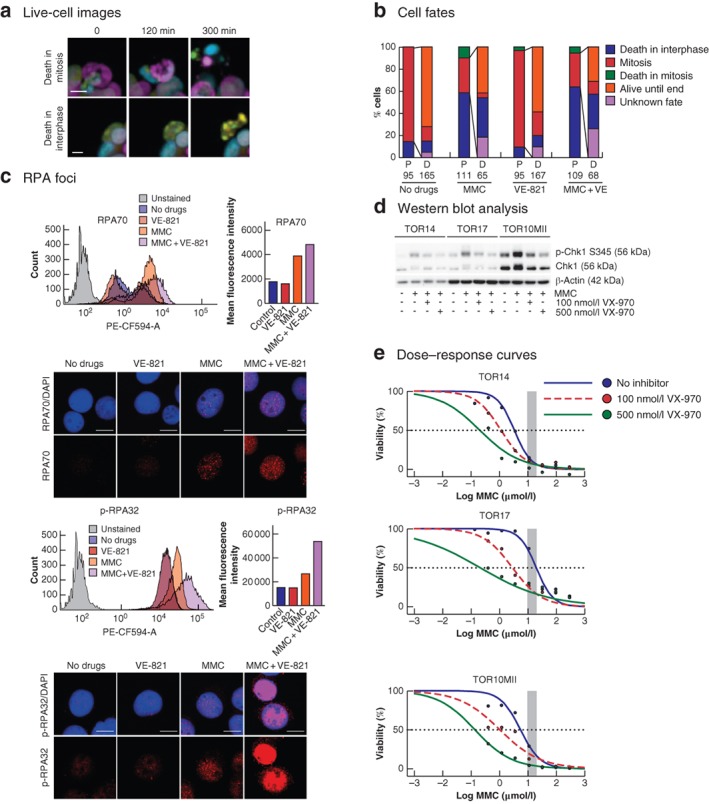
Effects of mitomycin C and ATR inhibition on cell fate and replication stress a Examples of cell death events observed during live‐cell imaging. Upper panel shows cell death in mitosis (cell death is preceded by mitotic chromosome condensation) and lower panel death in interphase (no chromosomal condensation observed before the formation of apoptotic bodies) (scale bar 10 μm). b Quantification of TOR14 cell fates observed during 72 h of live‐cell imaging after treatment with either no drugs, 0·5 μmol/l mitomycin C (MMC) for 90 min, 1 μmol/l VE‐821 for 72 h, or 0·5 μmol/l MMC for 90 min + 1 μmol/l VE‐821 for 72 h. If a parent cell (P) underwent mitosis, the fates of the resulting daughter cells (D) were also followed. c Analysis of replication protein A (RPA) foci in response to MMC or the combination treatment of MMC + VE‐821 in TOR14. Flow cytometry profiles for the different conditions are shown in the frequency distribution plots, and the mean intensities of the RPA or phosphorylated RPA (p‐RPA) signal per cell are plotted separately. PE‐CF594‐A, fluorescence area. Maximum projection confocal images of cells from the same experiment illustrate the increased number of RPA or p‐RPA foci in the combination treatment. The red signal represents the RPA or p‐RPA, and the blue signal shows 4′,6‐diamidino‐2‐phenylindole staining (scale bar 10 μm). d Western blot analysis of checkpoint kinase 1 (Chk1) phosphorylation after 90 min of treatment with hyperthermic MMC or the combination of MMC and VX‐970 (100 and 500 nmol/l); p‐Chk1 S345, Chk1 phosphorylated on serine 345. e Dose–response curves comparing MMC monotherapy and the combination of MMC and VX‐970 (100 and 500 nmol/l) in the individual organoids. The shaded area represents the clinically relevant concentration ranges determined in the clinical cohort. The dashed line crosses the individual curves at the concentration required to eliminate 50 per cent of the tumour cells.
