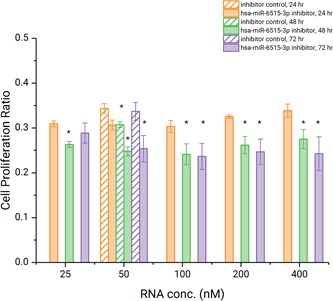
Figure 5.

SPC‐A1 cell proliferation after transfection of different amounts of miR‐6515‐3p inhibitor, quantified at 24, 48, and 72 hours by the EdU assay. The 48 and 72 hours data were compared with the 24 hours data by t test, and those with a P < .05 is denoted with an asterisk (*) mark. EdU, 5‐ethynyl‐2′‐deoxyuridine
