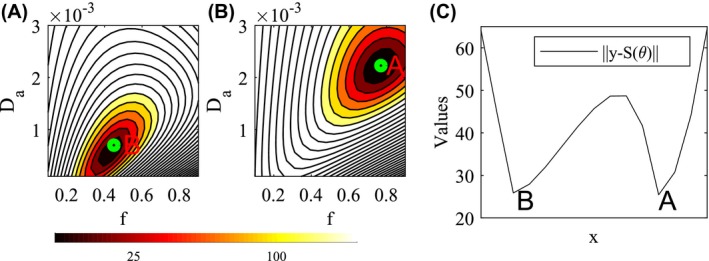
Figure 1.

Illustration of the degeneracy present in the likelihood function of the dMRI signal for the NODDIDA model. From the example NODDIDA parameters, θ, in the Set B of Jelescu et al11, we generated the dMRI measurements, y, for a clinically feasible protocol and SNR. The residual norm, ‖y‐S(θ)‖, presents 2 local minima with very similar values: the parameter point, A, generating the measurements, and another spurious minimum, B. Plots (A) and (B) display the cellular fraction, f, and intracellular diffusivity, , plane (fixing the rest of the parameters) including the parameter points B and A, respectively. Plot (C) displays the line connecting both local minima
