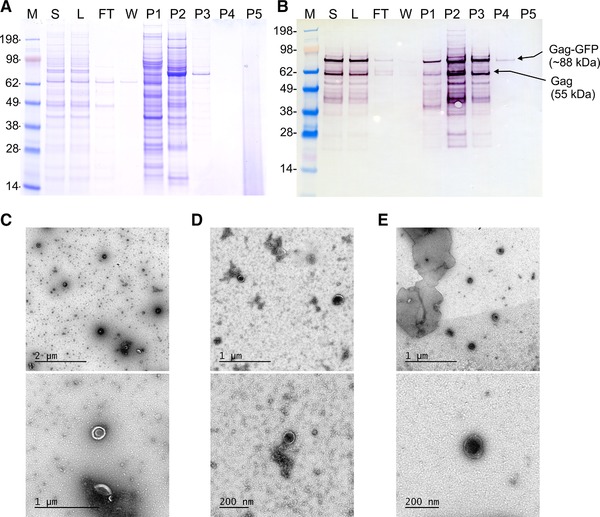
Figure 4.

A: SDS‐PAGE and B: Western blot analysis of the pooled fractions from the step gradient purification (Figure 3). (C), (D), and (E) electron microscopy micrographs of loading material (L) and fractions P2 and P3, respectively. M: molecular weight marker; S: cell culture supernatant; L: loading material; FT: flow‐through; W: wash; P1‐P4: pooled fractions for peaks 1–4
