
Figure 4.
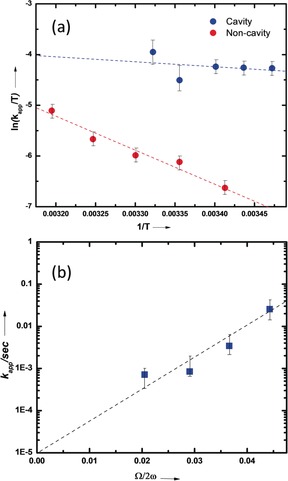
a) Eyring plot for reaction inside the cavity (blue circles) and non‐cavity (cell; red circles); b) Apparent rate constant as a function of Rabi splitting under VSC of 12EtOAc. Dotted lines are the corresponding linear fitting.
Official websites use .gov
A
.gov website belongs to an official
government organization in the United States.
Secure .gov websites use HTTPS
A lock (
) or https:// means you've safely
connected to the .gov website. Share sensitive
information only on official, secure websites.
a) Eyring plot for reaction inside the cavity (blue circles) and non‐cavity (cell; red circles); b) Apparent rate constant as a function of Rabi splitting under VSC of 12EtOAc. Dotted lines are the corresponding linear fitting.