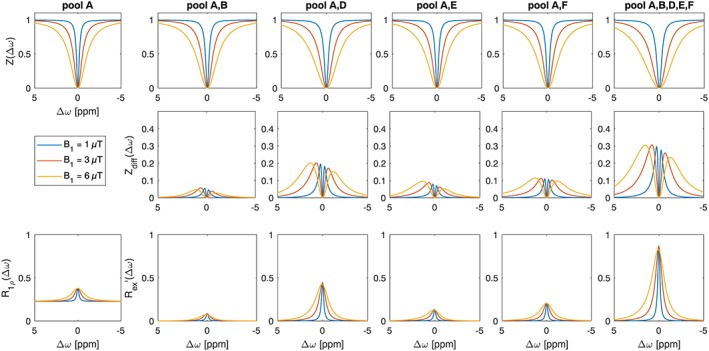
Figure 4.

Simulation of glucose model at 7 T in PBS. Top row: Z‐spectra; middle row: Zdiff for the derived physiological glucose model with different number of pools; bottom row: R1ρ of water, Rex contribution for each pool separately and combined (details about R1p and Rex are in reference36)
