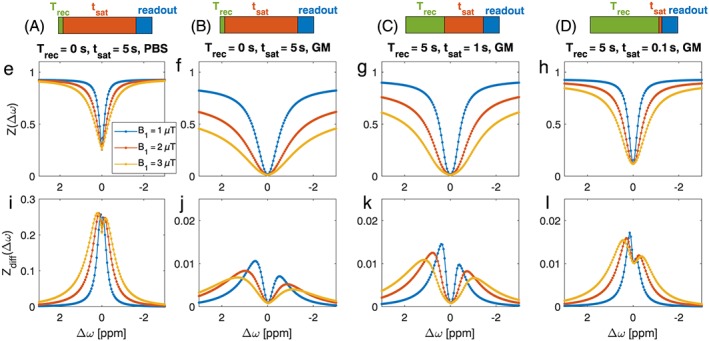
Figure 5.

(A‐D) Schemes of different saturation approaches used in each column: long steady‐state saturation (A,B), intermediate saturation with precedent recovery phase (C), and short saturation after long recovery (D). In silico model of four glucose hydroxyl pools for different saturation regimes at 7 T in PBS (E,I) and tissue‐like GM environment (F‐H,J‐L). Z‐spectra (E‐H) and Zdiff (I‐L) in the steady‐state CEST regime (E,F,I,J), the intermediate regime with only one second of saturation (G,K), and the spin‐lock regime with 100 ms of saturation (H,L)
