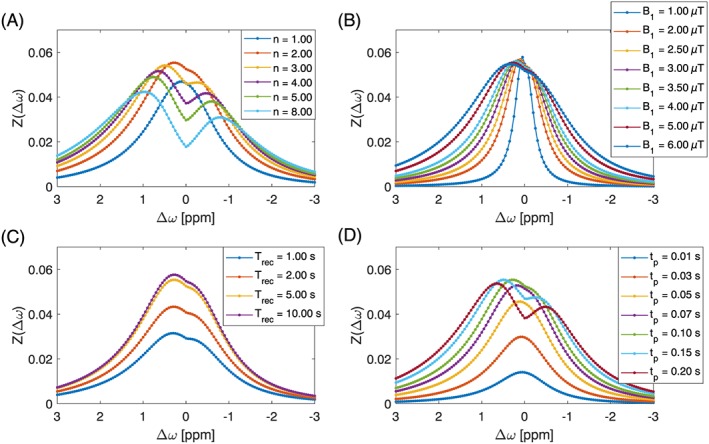
Figure 7.

Results of the manual optimization process. Zdiff of in silico model of glucose in tissue model 2 for different saturation parameters at 7 T. Optimal parameters: B1 = 5.00 μT, n = 2, Trec = 5.0 s, tp = 0.10 s; these were also the unchanged standard parameters for each subplot
