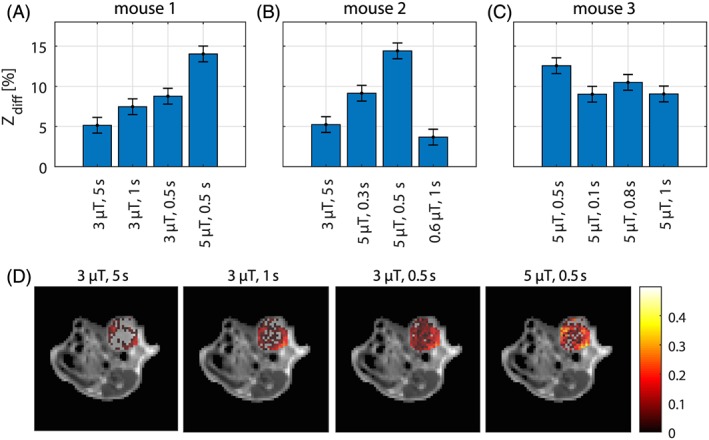
Figure 10.

In vivo glucose injection experiments in three mice bearing TS/A tumor xenografts using adiabatic SL prepared acquisition at 7 T. Data acquired at different saturation pulse power levels and durations were compared and evaluated using Zdiff at 1.2 ppm (Zdiff = Zpost‐Zpre). Bar plots of the average Zdiff calculated in ROI encompassing the whole tumor region for the experiments in (A) mouse 1, (B) mouse 2 and (C) mouse 3; (D) Zdiff images overlaid onto the T2w anatomical image for mouse 1 showing the effect of different saturation power levels and duration times on the calculated glucoCEST contrast upon CESL acquisition. CESL acquisition with B1 = 5 μT and tsat = 0.5 s yielded an average Zdiff of 13.7 ± 0.98% in the three investigated mice. Error bars in (A‐C) show this determined standard deviation
