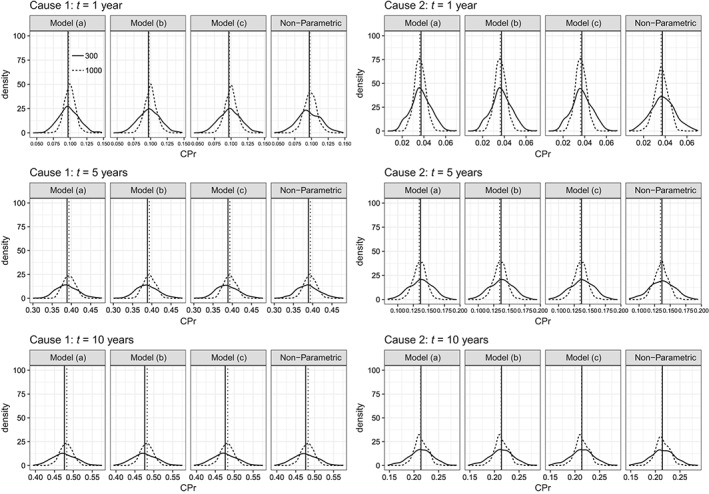
Figure 1.

Empirical distribution of the 500 parameter estimates of cumulative probabilities for each model and each cause at 3 timepoints: 1, 5, and 10 years in scenario 2. Vertical lines denote the true values. Model (a) has a quadratic B‐spline baseline function and knots at 1 and 5 years, whereas model (b) has a cubic B‐spline baseline function with the same knots. The explanatory variables in FPM models were age and sex. Models (b) and (c) have the same baseline function (cubic B‐spline with knots at 1 and 5 years), but model (b) has a fixed effect for sex, whereas model (c) has a TD effect for sex, which is modeled with a cubic B‐spline with two knots at 1 and 5 years
