
Figure 2.
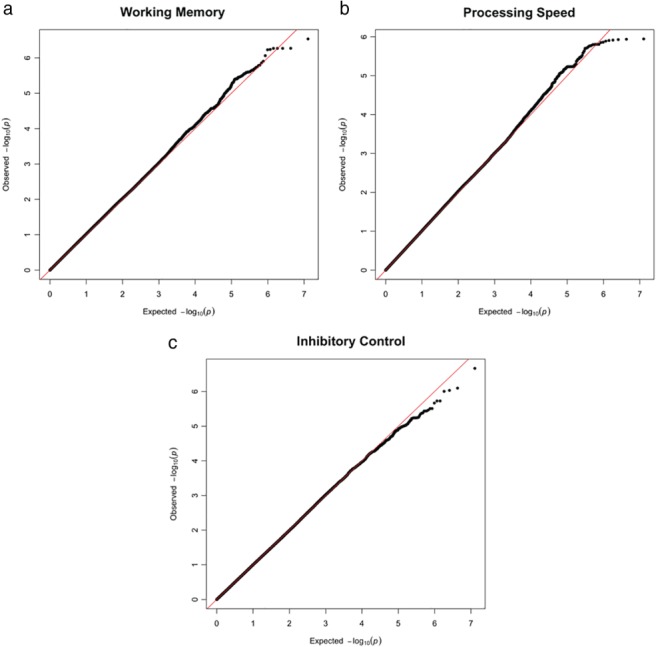
Quantile‐quantile plots (Q‐Q plots) for working memory, inhibitory control, and processing speed GWASes. Q‐Q plots show the distribution of p‐values against the expected p values. (a) Working memory, (b) Processing speed, (c) Inhibitory control.