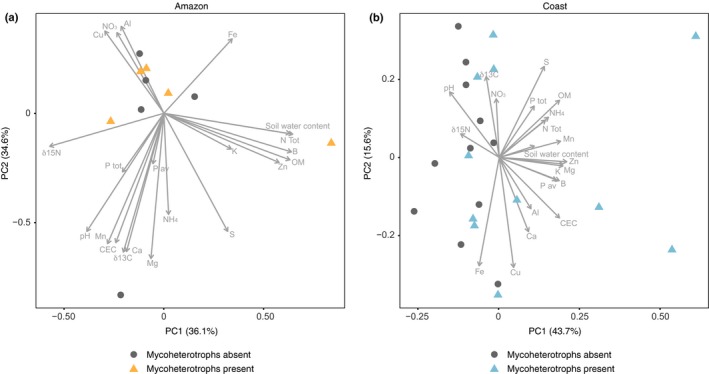
Figure 1.

Principal component (PC) analysis of the soil properties in the positive plots (triangles) and negative plots (circles) present in (a) the Amazon and (b) the coast. Length of the arrows represents the relative importance of individual properties in explaining the overall pattern.
