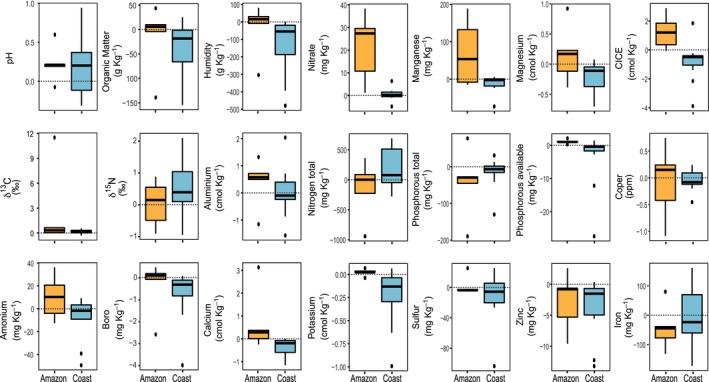
Figure 2.

Box and whisker plots representing the variation of soil properties between the negative and positive plots in the Amazon (yellow) and the coast (blue). Positive values indicate higher availability of a soil property in the negative plots, while negative values indicate a higher availability in the positive plots.
