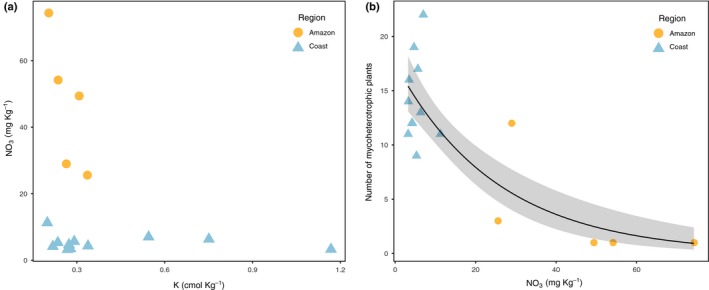
Figure 3.

Relationships between (a) the actual concentration of NO 3 vs K when in positive plots, showing the nature of interaction between the two nutrients. When K is the lowest, NO 3 varies, and when NO 3 is available in the lowest concentrations, K varies; and (b) the number of mycoheterotrophic plants observed in the positive 4 × 4 m plots and the concentration of NO 3. The solid line represents the observed trend with the 95% confidence interval (grey area).
