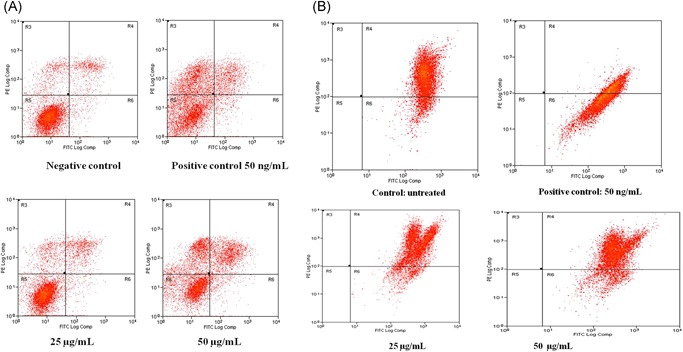
Figure 2.

Flow cytometric analysis in A549 cells for 24 hours using the Annexin V/FITC and mitochondrial membrane potential with dieckol of various concentrations. Each bar represents mean ± SEM of three independent observations. P < .05 is considered as statistically significant. FITC, fluorescein isothiocyanate
