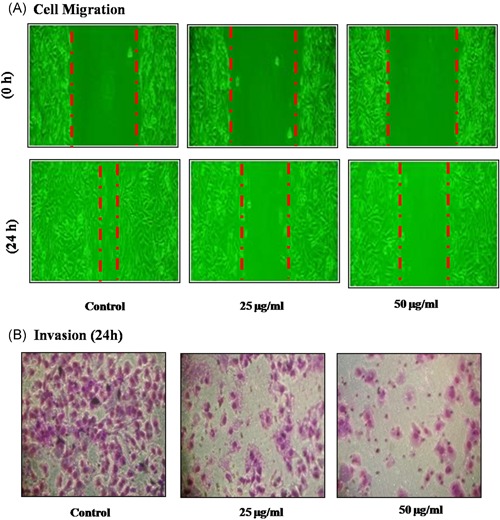
Figure 3.

Effect of dieckol on cell invasion and migration in non‐small–cell lung carcinoma A549 cell line. Each bar represents mean ± SEM of three independent observations. Representative images were shown at the magnification of ×100. The wound closure rate (A) and percentage of cell invaded (B) were calculated and represented as bar diagram. Each bar represents mean ± SEM of three independent observations. P < .05 is considered as statistically significant
