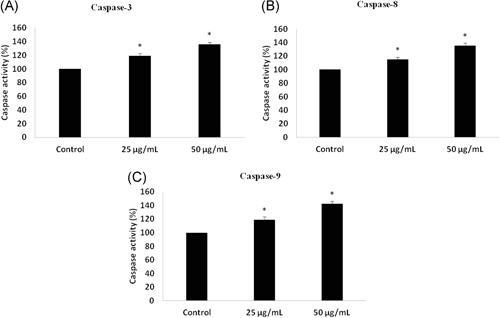
Figure 4.

Effect of dieckol on caspases non‐small–cell lung carcinoma A549 cell line. The activation of caspases by dieckol treatment were quantified and their activity were represented as bar diagram for caspase‐3 (A), caspase‐8 (B), and caspase‐9 (C) Each bar represents mean ± SEM of three independent observations. P < .05 is considered as statistically significant
