
Figure 4.
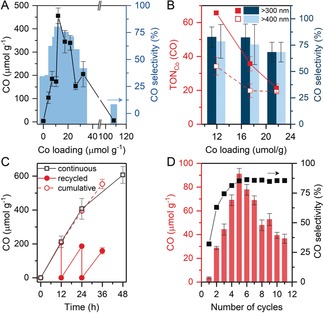
A) Dependence of the amount of CO evolved (black trace) and selectivity towards CO (blue bars) on Co loading (CO2‐saturated MeCN/TEOA, 24 h, 100 mW cm−2, AM 1.5G, λ>400 nm). B) Co‐based turnover numbers (TONCo) for CO evolution after 48 h under visible (λ>400 nm, dashed red trace) and UV/Vis (λ>300 nm, solid red trace) light; bar plot shows the CO selectivity. C,D) Catalyst recycling experiments performed under visible light. C) The solid and dashed red traces display the CO evolved during three cycles and the cumulative CO, respectively, with mpg‐CNx|CoPPc11.9 (≈2 mg). The black trace shows the CO accumulated during continuous irradiation. D) CO evolved during ten 4 h recycling runs with mpg‐CNx|CoPPc27 (≈8 mg) is plotted as bars and the black trace shows the selectivity.