Figure 1.

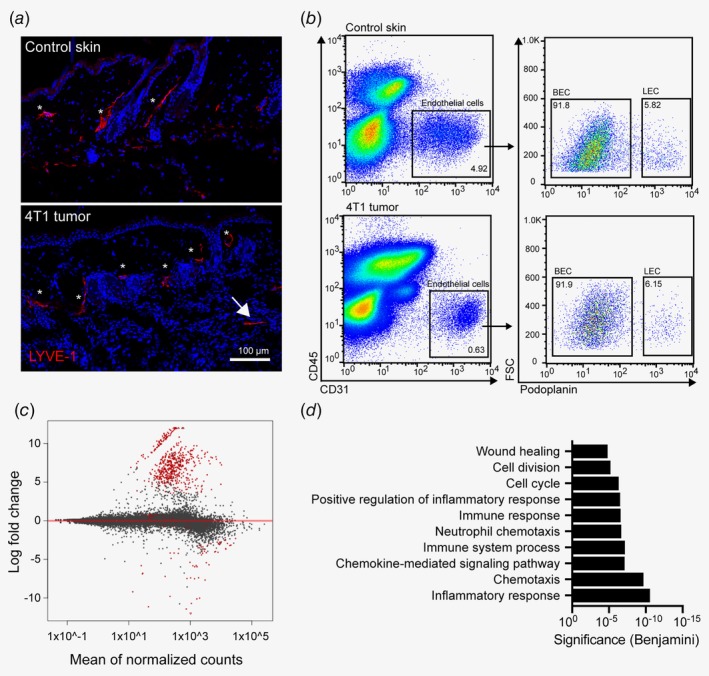
Transcriptional characterization of tumor‐associated lymphatic vessels in the 4T1 breast cancer model. (a) Representative images of abdominal skin of a naïve Balb/c mouse (top) and of a 4T1 tumor‐bearing mouse (bottom), showing lymphatic vessels stained for LYVE‐1 (red). Dermal/peritumoral lymphatic vessels are marked with asterisks, intratumoral lymphatic vessels with an arrow. (b) Representative FACS plots of control abdominal skin (top) and 4T1 tumor (bottom) single‐cell suspensions (pregated for living singlets) to illustrate the strategy for sorting of LECs. (c) Representation of RNA sequencing results of four control skin and five 4T1 tumor samples. Red dots indicate significantly (FDR < 0.01, log2FC > 2) differentially expressed genes in tumor‐associated LECs compared to control LECs. (d) Gene Ontology analysis (biological process) of significantly up‐regulated genes in 4T1‐associated LECs compared to control skin LECs. [Color figure can be viewed at wileyonlinelibrary.com]
