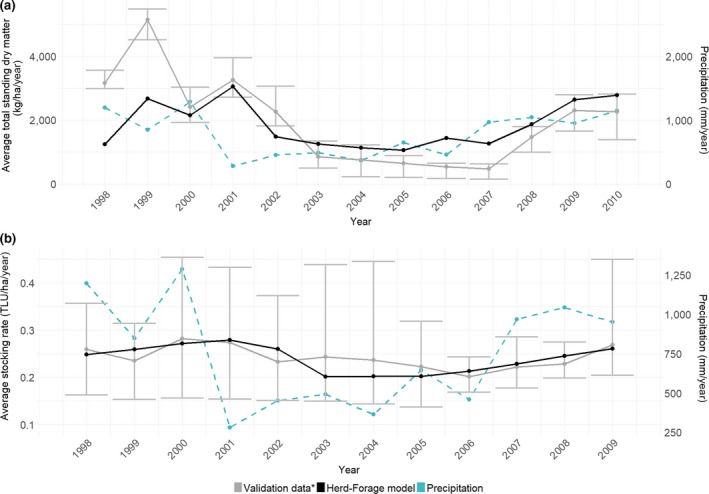
Figure 3.

Average annual total standing dry matter (a) and stocking rates (b) over time predicted by the herd‐forage model as compared to evaluation data sets. Period: 1998–2009/2010. The error bars represent the minimum and maximum values from the evaluation data sets. *Evaluation data for total standing dry matter: Scanlan et al. (2013)—GRASP model under moderate stocking rate; O'Reagain and Bushell (2011)—heavy stocking, moderate stocking, variable stocking, rotational wet season spelling coupled with moderate‐heavy stocking, Southern Oscillation Index stocking. Evaluation data for stocking rates: Ash et al. (2015)—baseline using GRASP model; Scanlan et al. (2013)—GRASP model under moderate stocking rate; O'Reagain and Bushell (2011)—heavy stocking, moderate stocking, variable stocking, rotational wet season spelling coupled with moderate‐heavy stocking, Southern Oscillation Index stocking from a grazing experiment. TLU, tropical livestock units
