
Figure 1.
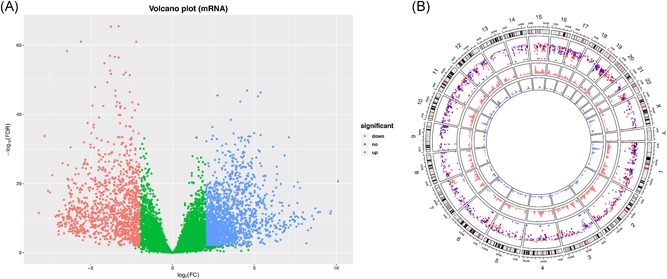
Identification of differentially expressed mRNAs. A, The volcano plot showed that a total of 1736 overexpressed mRNAs and 1147 low‐expressed mRNAs (tumor vs normal tissues) were screened out. B, Circos plot of genome‐wide differentially expressed mRNAs (green represents low‐expressed mRNAs and red represents overexpressed mRNAs). mRNAs, messenger RNAs