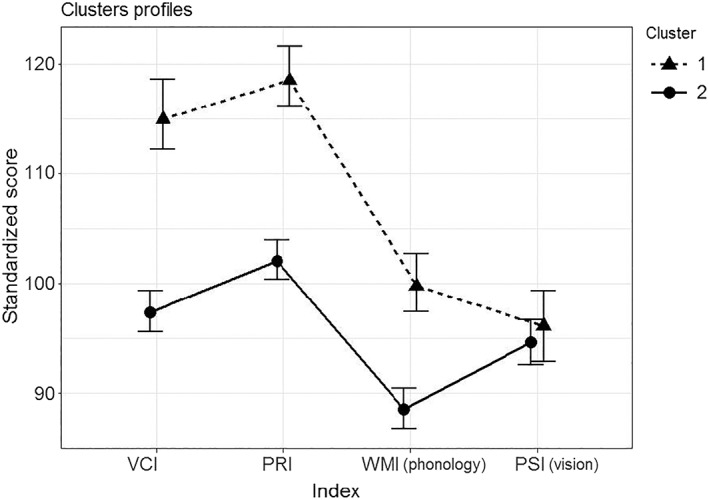
Figure 2.

Mean scores and standard errors estimated by the model for the indices Verbal Comprehension Index, Perceptual Reasoning Index, Working Memory Index (phonology), and Processing Speed Index (vision) on the two clusters. Cluster 1, N = 113 and Cluster 2, N = 203. Error bars represent 95% confidence intervals of the estimated mean values, computed via non‐parametric bootstrap (with 5,000 samples generation)
