
Figure 1.
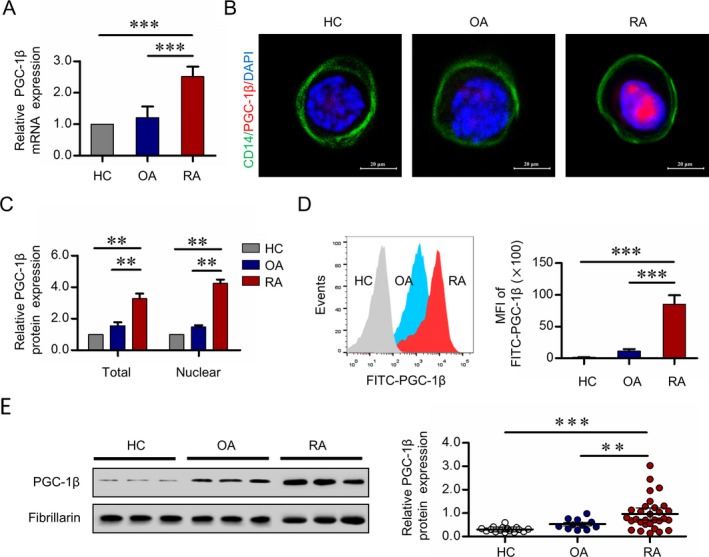
Expression of peroxisome proliferator–activated receptor γ coactivator 1β (PGC‐1β) in peripheral blood (PB) CD14+ monocytes. CD14+ monocytes were isolated from PB mononuclear cells from healthy controls (HCs), osteoarthritis (OA) patients, and rheumatoid arthritis (RA) patients by the use of CD14+ magnetic beads. A, Transcription of PGC‐1β was measured using quantitative polymerase chain reaction. B, Localization of PGC‐1β in PB CD14+ monocytes was detected by immunofluorescence staining. Original magnification × 1,000. C, PGC‐1β expression in total and nuclear protein from PB CD14+ monocytes was detected by Western blot analysis. Data in A and C are representative of results from independent experiments using samples from 6 healthy controls, 6 OA patients, and 6 RA patients. D, PGC‐1β protein levels in PB CD14+ monocytes were analyzed by flow cytometric analysis with fluorescein isothiocyanate (FITC). Left, Representative histograms showing the mean fluorescence intensity (MFI) in samples from 1 healthy control, 1 OA patient, and 1 RA patient are shown. Right, The MFIs of FITC‐conjugated PGC‐1β from peripheral CD14+ monocytes from 16 healthy controls, 11 OA patients, and 30 RA patients were compared. Values in A, C, and D are the mean ± SD. E, Left, Nuclear PGC‐1β protein expression in PB CD14+ monocytes was detected by Western blot analysis. Right, PGC‐1β band intensities were normalized to the values for fibrillarin and compared between groups. Symbols represent individual subjects (n = 16 healthy controls, n = 11 OA patients, and n = 30 RA patients) in independent analysis; bars show the mean ± SD. ** = P < 0.01; *** = P < 0.001, by Student's t‐test. Color figure can be viewed in the online issue, which is available at http://onlinelibrary.wiley.com/doi/10.1002/art.40868/abstract.