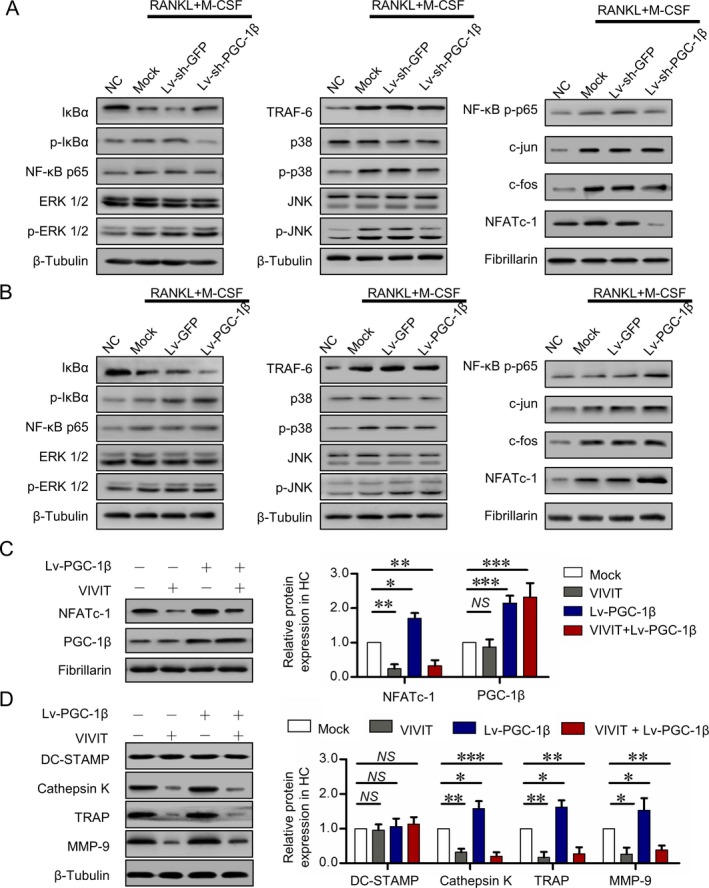
Figure 5.

Promotion of osteoclastogenesis by PGC‐1β through the NFATc1 pathway. A, Expression of tumor necrosis factor receptor–associated factor 6 (TRAF6), MAPK, activator protein 1 (AP‐1), and NFATc1 signaling pathways detected by Western blot analysis following stable knockdown of PGC‐1β in PB CD14+ monocytes from RA patients for 24 hours. B, Expression of TRAF6, MAPK, AP‐1, and NFATc1 pathways detected by Western blot analysis following stable overexpression of PGC‐1β in PB CD14+ monocytes from healthy controls for 24 hours. C, Expression of PGC‐1β and NFATc1 detected by Western blot analysis in PB CD14+ monocytes from healthy controls for 24 hours following PGC‐1β overexpression and inhibition of NFATc1. D, DC‐STAMP, cathepsin K, tartrate‐resistant acid phosphatase (TRAP), and matrix metalloproteinase 9 (MMP‐9) expression detected by Western blot analysis in PB CD14+ monocytes from healthy controls for 21 days following PGC‐1β overexpression and inhibition of NFATc1. Data were summarized from 3 independent experiments. Bars show the mean ± SD. * = P < 0.05; ** = P < 0.01; *** = P < 0.001, by Student's t‐test. NC = negative control; lv‐sh‐GFP = short hairpin RNA expression lentivirus expressing green fluorescent protein; lv‐sh‐PGC‐1β = shRNA expression lentivirus for PGC‐1β knockdown; M‐CSF = macrophage colony‐stimulating factor; NS = not significant (see Figure 1 for other definitions). Color figure can be viewed in the online issue, which is available at http://onlinelibrary.wiley.com/doi/10.1002/art.40868/abstract.
