

Abstract
Aim
To compare glycaemic control, hypoglycaemia and treatment discontinuation of insulin glargine 300 units/mL (Gla‐300) and insulin degludec (IDeg) in a real‐world study of insulin‐naïve adults with type 2 diabetes (T2D).
Materials and methods
DELIVER Naive D was a retrospective observational study that used electronic medical record data from the IBM Watson Health Explorys database. Insulin‐naïve adults with T2D who started Gla‐300 or IDeg between March 2015 and September 2017 were identified. Patients were active in the system for ≥12 months before and ≥6 months after starting Gla‐300 or IDeg and had HbA1c measurements during 6‐month baseline and 3‐ to 6‐month follow‐up. Outcomes were compared among 1:1 propensity score‐matched cohorts.
Results
In the matched cohorts (n = 638 each), the mean age was 59 years, approximately 53% were male, and mean HbA1c was 9.67% (82 mmol/mol). Mean (SD) HbA1c decreases were comparable in the Gla‐300 and IDeg cohorts (−1.67% [2.22] and −1.58% [2.20]; P = 0.51), as were HbA1c target attainment [<7% (53 mmol/mol): 23.8% and 27.4%; P = 0.20; <8% (64 mmol/mol): 55.0% and 57.1%; P = 0.63] and treatment discontinuation (29.2% and 32.6%; P = 0.14). Overall and inpatient/emergency department‐associated hypoglycaemia incidences and event rates were similar in both cohorts using fixed 6‐month or variable on‐treatment follow‐up.
Conclusions
Among real‐world insulin‐naïve adults with T2D, initiation of Gla‐300 or IDeg resulted in comparable improvements in glycaemic control and similar rates of hypoglycaemia. These real‐world data complement and confirm a randomized trial and other real‐world studies.
Keywords: basal insulin, hypoglycaemia, observational study, type 2 diabetes
1. INTRODUCTION
The American Diabetes Association guidelines for adults with type 2 diabetes (T2D) recommend first‐line treatment with metformin and lifestyle changes.1 If the patient's HbA1c goal is not met within 3 months of starting metformin, a second non‐insulin agent should be considered. If needed, treatment should continue to be intensified by adding further non‐insulin agents or basal insulin until the individualized HbA1c target is achieved.1
The second‐generation basal insulin analogues, insulin glargine 300 units/mL (Gla‐300; Toujeo; Sanofi2) and insulin degludec 100 and 200 units/mL (IDeg; Tresiba; Novo Nordisk3) have been available in the United States since 2015. These have more stable pharmacokinetic and pharmacodynamic profiles than the first‐generation basal insulin analogue, insulin glargine 100 units/mL (Gla‐100).4, 5 Recent meta‐analyses of the EDITION and BEGIN randomized controlled trials (RCTs) have shown that Gla‐300 results in significantly less anytime and nocturnal hypoglycaemia than Gla‐100, while IDeg results in similar anytime and significantly less nocturnal hypoglycaemia than Gla‐100.6
The DELIVER Naive real‐world observational study, which used electronic medical record (EMR) data, showed improved HbA1c control and suggested reduced hypoglycaemia with Gla‐300 versus Gla‐100 in insulin‐naïve adults with T2D.7 Two other real‐world, observational studies (DELIVER D8 and DELIVER D+9) compared Gla‐300 and IDeg in patients with T2D who switched from first‐generation basal insulin analogues. Both studies found that Gla‐300 and IDeg resulted in comparable reductions in HbA1c and similar levels of hypoglycaemia.
The recent BRIGHT trial, which randomized insulin‐naïve patients with T2D to Gla‐300 and IDeg, reported that both second‐generation basal insulin analogues resulted in similar reductions in HbA1c and similar levels of hypoglycaemia during the whole 6‐month study period, with less anytime hypoglycaemia with Gla‐300 during the initial 3‐month insulin titration period.10
The objective of the DELIVER Naïve D study was to compare clinical outcomes (glycaemic control and hypoglycaemia) and treatment discontinuation in insulin‐naïve adults with T2D who initiated Gla‐300 or IDeg in real‐world clinical practice.
2. MATERIALS AND METHODS
2.1. Study design and data source
DELIVER Naive D was a retrospective, observational study that used data from EMRs obtained from the Predictive Health Intelligence Environment (IBM Watson Health Explorys) database. This database contains a geographically diverse spectrum of longitudinal medical data (patient demographics, insurance, admissions and encounters, diagnoses, procedures and associated laboratory values, and surgeries) from 39 major integrated delivery networks across the United States. Data are standardized using common ontologies such as International Classification of Diseases (ICD)‐9‐clinical modification (CM) or ICD‐10‐CM codes and National Drug Codes. The database includes outpatient, inpatient and postacute care data of ~50 million patients, with an average of 3–4 years of longitudinal data. The data were standardized, normalized and harmonized to create a curated longitudinal patient record connecting all data sources and venues of care by IBM Explorys.11 A full longitudinal view of each patient's de‐identified history was available across the care continuum. The study period was 1 March 2014 to 31 March 2018.
2.2. Study population
Adult patients (aged ≥18 years) with T2D by ICD‐9‐CM or ICD‐10‐CM codes12 on oral antihyperglycaemic drugs and/or a glucagon‐like peptide‐1 receptor agonist (GLP‐1 RA) who started Gla‐300 or IDeg between 1 March 2015 and 30 September 2017 were identified. The date of first prescription of Gla‐300 or IDeg was defined as the index date. Patients had to have been actively registered in the EMR system for ≥12 months before and ≥6 months after their index date. In order to enable proper analysis of the HbA1c reductions, patients also had to have ≥1 valid HbA1c measurement during 6‐month baseline and ≥1 valid HbA1c measurement during 3‐ to 6‐month follow‐up. Patients with any of the following were excluded: insulin prescription during 12‐month baseline, prescriptions for >1 basal insulin on the index date; or type 1 diabetes (T1D). T1D was identified by ICD‐9‐CM or ICD‐10‐CM codes.12 Patients with T1D and T2D diagnoses were classified as having T1D (i.e. excluded) if more than half of their ICD diagnoses were for T1D and they met any of the following criteria: glucagon prescription; no record of antidiabetic prescription other than metformin; or drug record of metformin and diagnosis of polycystic ovarian syndrome and no record of antidiabetic prescription other than metformin.
Data extracted from the EMRs included: age, sex, race, insurance type, United States geographic region, physician speciality associated with the index event; body mass index (latest during 12‐month baseline); HbA1c (latest during 6‐month baseline); hypoglycaemia (during 6‐ and 12‐month baseline); comorbidities, diabetic complications, and medication use (for diabetes and other conditions) (during 12‐month baseline); healthcare utilization (during 6‐month baseline); and initial basal insulin dose (only available for ~33% of patients).
2.3. Propensity score matching
To address baseline imbalances between the Gla‐300 and IDeg cohorts, patients were propensity score matched13 (1:1) based on all available baseline demographics and clinical characteristics (Table 1) apart from initial basal insulin dose (as this was only available in ~33% of patients), using a greedy nearest‐neighbour algorithm. This procedure selected a patient treated with Gla‐300 or IDeg (depending on which prematched group had the fewest patients) and then selected the closest matched patient treated with the other basal insulin. Once a match was made, patients were not reconsidered for further matching. Next, 8‐2‐digit matching was performed, starting sequentially from the highest to the lowest digit match. Interaction terms applied to the propensity score analysis included calendar year and United States geographic region, to account for possible differences in product market access and formulary changes. To assess any imbalances after matching, Χ 2 or 2‐sample t‐tests were performed, and standardized mean differences (SMDs) calculated. An SMD <0.10 was taken to indicate a negligible difference between cohorts.14
Table 1.
Baseline patient characteristics after propensity score matching
| Gla‐300 (n = 638) | IDeg (n = 638) | P‐value | SMD | |
|---|---|---|---|---|
| Age, mean (SD), y | 59.0 (12.2) | 58.9 (12.7) | 0.84 | 0.01 |
| Male, n (%) | 345 (54.1) | 333 (52.2) | 0.64 | 0.04 |
| Race, n (%) | ||||
| Caucasian | 496 (77.7) | 488 (76.5) | 0.80 | 0.03 |
| African American | 85 (13.3) | 85 (13.3) | 1.00 | 0.00 |
| Other | 30 (4.7) | 39 (6.1) | 0.28 | 0.06 |
| Unknown | 27 (4.2) | 26 (4.1) | 0.89 | 0.01 |
| Insurance type, n (%) | ||||
| Commercial | 294 (46.1) | 279 (43.7) | 0.53 | 0.05 |
| Medicare | 174 (27.3) | 176 (27.6) | 0.91 | 0.01 |
| Medicaid | 21 (3.3) | 33 (5.2) | 0.10 | 0.09 |
| Other | 18 (2.8) | 26 (4.1) | 0.23 | 0.07 |
| Unknown | 131 (20.5) | 124 (19.4) | 0.66 | 0.03 |
| United States geographic region, n (%) | ||||
| Midwest | 389 (61.0) | 388 (60.8) | 0.97 | 0.00 |
| South | 227 (35.6) | 226 (35.4) | 0.96 | 0.00 |
| West | 21 (3.3) | 22 (3.4) | 0.88 | 0.01 |
| Northeast | 1 (0.2) | 2 (0.3) | 0.56 | 0.03 |
| Physician speciality associated with index event, n (%) | ||||
| Primary care practitioner | 295 (46.2) | 289 (45.3) | 0.80 | 0.02 |
| Internal medicine | 122 (19.1) | 125 (19.6) | 0.85 | 0.01 |
| Endocrinologist | 39 (6.1) | 37 (5.8) | 0.82 | 0.01 |
| Other/unknown | 182 (28.5) | 187 (29.3) | 0.79 | 0.02 |
| HbA1c,a , b mean (SD), % | 9.71 (1.99) | 9.63 (2.03) | 0.49 | 0.04 |
| Body mass index,a , c , d, mean (SD), kg/m2 | 33.5 (7.1) | 33.3 (7.1) | 0.55 | 0.03 |
| GLP‐1 RA,c n (%) | 143 (22.4) | 146 (22.9) | 0.86 | 0.01 |
| OADs,c n (%) | 489 (76.6) | 490 (76.8) | 0.97 | 0.00 |
| Metformin | 334 (52.4) | 329 (51.6) | 0.85 | 0.02 |
| Sulfonylureas | 271 (42.5) | 266 (41.7) | 0.83 | 0.02 |
| DPP‐4 inhibitor | 210 (32.9) | 222 (34.8) | 0.56 | 0.04 |
| SGLT‐2 inhibitor | 144 (22.6) | 146 (22.9) | 0.91 | 0.01 |
| Thiazolidinediones | 52 (8.2) | 59 (9.2) | 0.51 | 0.04 |
| Meglitinides | 13 (2.0) | 8 (1.3) | 0.28 | 0.06 |
| Alpha‐glucosidase inhibitor | 5 (0.8) | 8 (1.3) | 0.41 | 0.05 |
| Number of OADs, mean (SD) | 1.6 (0.9) | 1.6 (1.0) | 0.84 | 0.01 |
| Comorbidities/diabetic complications,c n (%) | ||||
| Hyperlipidaemia | 466 (73.0) | 505 (79.2) | 0.21 | 0.14 |
| Hypertension | 476 (74.6) | 475 (74.5) | 0.97 | 0.00 |
| Obesity | 216 (33.9) | 217 (34.0) | 0.96 | 0.00 |
| Neuropathy | 93 (14.6) | 100 (15.7) | 0.61 | 0.03 |
| Depression | 74 (11.6) | 85 (13.3) | 0.38 | 0.05 |
| Nephropathy | 28 (4.4) | 27 (4.2) | 0.89 | 0.01 |
| Retinopathy | 30 (4.7) | 20 (3.1) | 0.16 | 0.08 |
| Dementia | 3 (0.5) | 2 (0.3) | 0.65 | 0.03 |
| Elixhauser Index Score, mean (SD) | 3.5 (1.8) | 3.5 (1.7) | 0.94 | 0.00 |
| Patients with hypoglycaemia events,b n (%) | 44 (6.9) | 48 (7.5) | 0.68 | 0.02 |
| Hypoglycaemia events,b mean (SD) | 0.1 (0.6) | 0.1 (0.5) | 0.74 | 0.02 |
| Patients with hypoglycaemia events,c n (%) | 55 (8.6) | 57 (8.9) | 0.85 | 0.01 |
| Hypoglycaemia events,c mean (SD) | 0.2 (0.9) | 0.2 (0.8) | 0.89 | 0.01 |
| Concomitant medication,c n (%) | ||||
| Statins | 329 (51.6) | 335 (52.5) | 0.82 | 0.02 |
| ACE inhibitors | 209 (32.8) | 197 (30.9) | 0.55 | 0.04 |
| Beta‐blockers | 143 (22.4) | 129 (20.2) | 0.40 | 0.05 |
| Angiotensin receptor blockers | 59 (9.2) | 49 (7.7) | 0.34 | 0.06 |
| Calcium channel blockers | 30 (4.7) | 29 (4.5) | 0.90 | 0.01 |
| Diuretics | 17 (2.7) | 11 (1.7) | 0.26 | 0.06 |
| Healthcare utilization,b n (%) | ||||
| Emergency department | 126 (19.7) | 127 (19.9) | 0.95 | 0.00 |
| Endocrine outpatient visits | 82 (12.9) | 78 (12.2) | 0.75 | 0.02 |
| Inpatient | 47 (7.4) | 41 (6.4) | 0.52 | 0.04 |
| Mean initial dose,e mean (SD) | 22.0 (19.6) | 20.7 (17.4) | 0.46 | 0.07 |
Abbreviations: ACE, angiotensin‐converting enzyme; DDP‐4, dipeptidyl peptidase‐4; Gla‐300, insulin glargine 300 units/mL; GLP‐1 RA, glucagon‐like peptide‐1 receptor agonist; IDeg, insulin degludec; OAD, oral antidiabetes drug; SD, standard deviation; SGLT‐2, sodium‐glucose co‐transporter‐2; SMD, standardized mean difference.
Latest value during baseline.
During 6 months before the index date.
During 12 months before the index date.
Among 613 Gla‐300 and 620 IDeg patients with available data.
Among 212 Gla‐300 and 240 IDeg patients with available data.
2.4. Outcomes
All outcomes were compared between the propensity score‐matched cohorts of patients who initiated Gla‐300 or IDeg. HbA1c change was the reduction from the latest value during 6‐month baseline to the latest value during 3‐ to 6‐month follow‐up. HbA1c target attainment [<7% and <8% (53 and 64 mmol/mol, respectively)] was assessed using the latest value during 3‐ to 6‐month follow‐up, overall and among those without hypoglycaemia. Hypoglycaemia (ICD‐9‐CM/ICD‐10‐CM diagnoses and/or blood glucose ≤70 mg/dL) was assessed as all captured events and those associated with an inpatient or emergency department (ED) encounter.
2.5. Statistical analysis
Categorical variables are presented as frequencies and percentages; continuous variables as means and standard deviations (SDs). Comorbidities were used to calculate Elixhauser comorbidity indexes.15
HbA1c reductions from baseline to follow‐up were tested within each matched cohort using paired t‐tests. HbA1c reductions were then compared between cohorts using a 2‐sample t‐test. HbA1c goal attainment between cohorts was tested using Χ 2 tests.
Hypoglycaemia outcomes (any and those associated with an inpatient/ED encounter) were assessed in two ways: an intent‐to‐treat (ITT) approach (events during fixed 6‐month follow‐up) and an on‐treatment (OT) approach (events until treatment discontinuation or 6‐month follow‐up). Treatment discontinuation was defined as: no active prescription of the basal brand patients were initiated on, for up to 45 days from the latest prescription end date; or switch to another basal insulin brand.
ITT hypoglycaemia incidences [number (%) of patients with any event(s)] were compared between cohorts using logistic regression adjusting for baseline hypoglycaemia to calculate adjusted odds ratios (aORs). ITT hypoglycaemia event rates [events per patient per year (PPPY)] were compared between cohorts using generalized linear models adjusting for baseline hypoglycaemia to calculate least‐squares mean (LSM) differences. OT crude incidences [patients with ≥1 event per person‐year (PPY) at risk (to first event)] were compared between cohorts using a proportional hazard Cox model adjusting for baseline hypoglycaemia to calculate adjusted hazard ratios (aHRs). OT hypoglycaemia event rates [events PPY at risk (to discontinuation or end of 6‐month follow‐up)] were compared between cohorts using Poisson regression adjusting for baseline hypoglycaemia to calculate adjusted rate ratios (aRRs).
Time‐to‐discontinuation of the initial basal insulin and/or initiation of a subsequently prescribed different basal insulin was analysed using a proportional hazard Cox model, adjusting for factors including baseline patient demographics and clinical characteristics. Log rank tests were conducted to compare the Gla‐300 and IDeg groups' hazard functions.
2.6. Sensitivity analyses
Sensitivity analyses for HbA1c outcomes were conducted by: (i) limiting eligible patients to those who did not discontinue their index basal insulin treatment within 75 days of the index date; and (ii) considering the first HbA1c value during the 3‐ to 6‐month follow‐up. Sensitivity analyses for hypoglycaemia outcomes were conducted by only considering hypoglycaemia events identified by: (i) ICD codes (with or without blood glucose ≤70 mg/dL); and (ii) blood glucose ≤70 mg/dL (with or without an ICD code).
3. RESULTS
3.1. Study population
The patient flow diagram is shown in Figure 1. Prior to propensity score matching, there were 1277 patients in the Gla‐300 cohort and 653 in the IDeg cohort. Patients who initiated Gla‐300 were significantly more likely to be older, covered by Medicare, be from the Northeast United States geographic region, have been seen by an endocrinologist for their index event, and have taken calcium channel blockers and diuretics during baseline; but significantly less likely to have used a GLP‐1 RA or had an ED visit during baseline (Appendix S1).
Figure 1.

Patient attrition diagram. †Identification period from March 1, 2015 to September 30, 2017. Abbreviations: EMR, electronic medical record; Gla‐100, insulin glargine 100 units/mL; Gla‐300, insulin glargine 300 units/mL; GLP‐1 RA, glucagon‐like peptide‐1 receptor agonist; IDeg, insulin degludec; IDet, insulin detemir; OAD, oral antidiabetes drug; T1D, type 1 diabetes; T2D, type 2 diabetes
These baseline differences were almost entirely mitigated after matching, and although differences in hyperlipidaemia between the cohorts exceeded the SMD threshold, the difference was not statistically different (SMD = 0.14; P = 0.21) (Table 1). In the propensity score‐matched Gla‐300 and IDeg cohorts (n = 638 each), the mean ages were 59.0 and 58.9 years, respectively; 54.1% and 52.2% of patients were male; mean body mass indexes were 33.5 and 33.3 kg/m2; and 22.4% and 22.9% had prior GLP‐1 RA use, respectively. Mean initial basal insulin doses were 22.0 units for Gla‐300 and 20.7 units for IDeg among 212 and 240 patients, respectively, with the dosage information available.
3.2. Outcomes
Mean (SD) HbA1c decreased significantly from baseline to follow‐up in both groups; and these reductions were comparable in the Gla‐300 and IDeg cohorts [−1.67% (2.22) vs. –1.58% (2.20), respectively; P = 0.51; Figure 2A]. Patients in both cohorts were also similarly likely to attain the HbA1c targets [<7% and <8% (53 and 64 mmol/mol, respectively)], overall (Figure 2B) and without hypoglycaemia (Figure 2C).
Figure 2.

HbA1c outcomes among matched patients. (A) Mean (SD) changes from baseline (latest value during 6‐month baseline) to follow‐up (latest value during 3‐ to 6‐month follow‐up). (B) Attainment of glycaemic goals [<7% and <8% (53 and 64 mmol/Mol, respectively)]. (C) Attainment of glycaemic goals without hypoglycaemia. Abbreviations: Gla‐300, insulin glargine 300 units/mL; IDeg, insulin degludec; SD, standard deviation
By the ITT method, overall and inpatient/ED‐associated hypoglycaemia incidences (Figure 3A) and event rates (Figure 3B) were similar in both cohorts. This was also the case using the OT method (Figure 3C).
Figure 3.
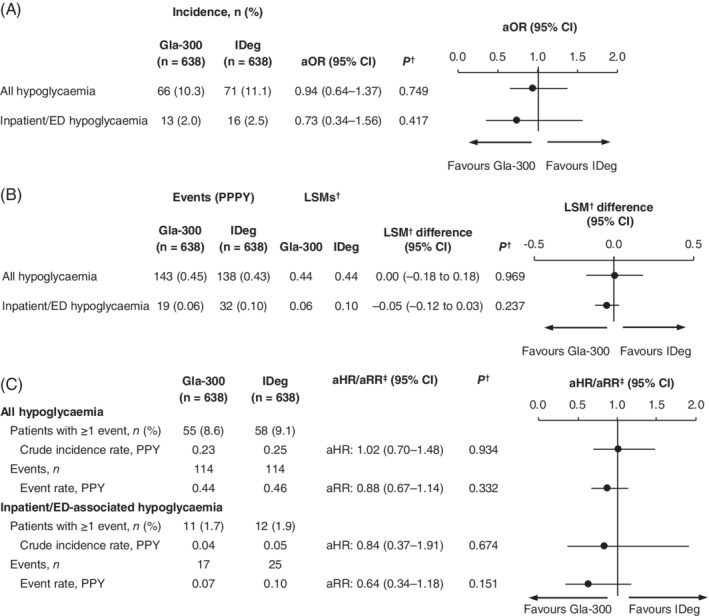
Hypoglycaemia outcomes among matched patients. (A) Incidence during fixed 6‐month follow‐up (ITT). (B) Event rates during fixed 6‐month follow‐up (ITT). (C) Incidence and event rates during variable follow‐up (OT). †Adjusted for baseline hypoglycaemia incidence. ‡aHR for patients with ≥1 event (logistic regression); aRR for event rate (Poisson's regression). Abbreviations: aHR, hazard ratio adjusted for baseline hypoglycaemia; aOR, odds ratio adjusted for baseline hypoglycaemia; aRR, rate ratio adjusted for baseline hypoglycaemia; CI, confidence interval; ED, emergency department; Gla‐300, insulin glargine 300 units/mL; IDeg, insulin degludec; ITT, intention‐to‐treat; LSM, least squares mean; OT, on‐treatment; PPPY, per person per year; PPY, per person‐year
Similar proportions of patients in the Gla‐300 and IDeg cohorts discontinued therapy by the end of 6‐month follow‐up (29.2% vs. 32.6%, respectively; aHR 0.86; 95% CI 0.71–1.05; P = 0.14; Figure 4).
Figure 4.
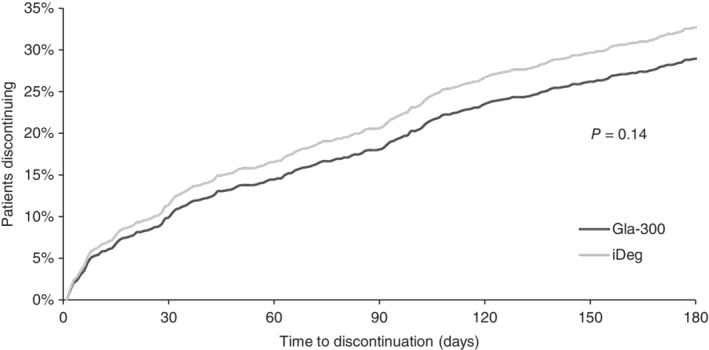
Time to treatment discontinuation. Abbreviations: Gla‐300, insulin glargine 300 units/mL; IDeg, insulin degludec
3.3. Sensitivity analyses
Restricting eligibility to those who did not discontinue their basal insulin within 75 days of the index date had no impact on the mean HbA1c reductions in the Gla‐300 and IDeg cohorts [−1.62% (2.19) vs. –1.51% (2.17), respectively; P = 0.42] or target attainment [<7% (53 mmol/mol): 22.2% vs. 26.4%, respectively; P = 0.17; <8% (64 mmol/mol): 53.2% vs. 56.5%, respectively; P = 0.46]. Using the first HbA1c value during the 3‐ to 6‐month follow‐up also had no impact on mean HbA1c reductions in the Gla‐300 and IDeg cohorts [−1.63% (2.25) vs. –1.56% (2.24), respectively; P = 0.58] or target attainment [<7% (53 mmol/mol): 23.0% vs. 27.0%; P = 0.16; <8% (64 mmol/mol): 53.6% vs. 57.1%, respectively; P = 0.41].
Restricting hypoglycaemia events to those identified by ICD codes or blood glucose ≤70 mg/dL captured approximately 64% and 37% of all events, respectively, and 24% and 82% of inpatient/ED‐associated events, respectively. There were no significant between‐cohort differences for any of the hypoglycaemia outcomes in these sensitivity analyses (Appendixes S2 and S3).
4. DISCUSSION
In this large, real‐world, observational study of EMRs with propensity score‐matched cohorts, insulin‐naïve adults with T2D who initiated Gla‐300 or IDeg had comparable HbA1c reductions, HbA1c target attainments, and hypoglycaemia. This is consistent with the recent 6‐month BRIGHT trial,10 in which 929 insulin‐naïve adults with uncontrolled T2D were randomized 1:1 to Gla‐300 or IDeg. The BRIGHT trial authors reported comparable reductions in HbA1c and similar attainment of HbA1c targets; they also reported comparable hypoglycaemia outcomes with Gla‐300 and IDeg during the whole 6‐month study period.10
Results from the current study are also in line with those from three real‐world, observational studies that have compared outcomes among insulin‐naïve16 or insulin‐experienced8, 9, 16 adults with T2D. The real‐world, observational LIGHTNING study of EMRs (Optum Humedica database) included adults with T2D who newly initiated or switched to Gla‐100, insulin detemir (IDet), Gla‐300, or IDeg.16 The LIGHTNING study reported comparable HbA1c reductions and severe hypoglycaemia event rates among propensity score‐matched patients who newly initiated Gla‐300 or IDeg, and among those who switched to Gla‐300 or IDeg. LIGHTNING also used machine learning methodology to develop a model to predict severe hypoglycaemia rates among vulnerable subgroups of patients. Using this model, no significant differences in severe hypoglycaemia were predicted with Gla‐300 versus IDeg among insulin‐naïve patients or among those who switched to Gla‐300 versus IDeg for patients at increased hypoglycaemic risk, those with moderate/severe renal impairment, or those aged ≥65 or ≥ 75 years.16 In DELIVER D,8 all patients switched from Gla‐100 to Gla‐300 or IDeg, while in DELIVER D+,9 patients switched from Gla‐100 or IDet to Gla‐300 or IDeg. Both studies reported similar HbA1c reductions, HbA1c target attainment, and hypoglycaemia outcomes with Gla‐300 and IDeg.8, 9
However, in contrast to the current study, the BRIGHT trial,10 and other recent real‐world studies,8, 9, 16 the CONFIRM observational study17 has reported contradictory results. The CONFIRM study examined the EMRs of insulin‐naïve adults with T2D from the same database as the current study (Explorys; IBM Watson Health), but reported that IDeg was associated with a significantly larger mean HbA1c reduction and significantly greater “reductions in the change in the likelihood of hypoglycaemia” than Gla‐300.17 The CONFIRM findings, however, appear to be the consequence of methodological differences and lingering imbalances in baseline confounders despite propensity score matching. Furthermore, both the HbA1c (primary endpoint) and hypoglycaemia (secondary endpoints) analyses were based on subgroups of the matched cohort, and it is clear from the reported data that the hypoglycaemia analyses (~67% of the matched population) were not well matched for baseline hypoglycaemia (Gla‐300 vs. IDeg: 5.4% vs. 7.9%; 0.21 vs. 0.30 PPY). In fact, the CONFIRM supplementary data show that hypoglycaemia rates and incidences during basal insulin treatment with Gla‐300 and IDeg are comparable, in line with the results of the present study. Furthermore, as only ~33% of the matched patients were included in the HbA1c analysis, there may also be baseline imbalances here too, perhaps providing an explanation for the CONFIRM study's deviation from the current evidence base. Finally, it is worth noting that the CONFIRM population appears to have a pattern of baseline medication that is inconsistent with what might be expected for an insulin‐naïve cohort. Initial insulin doses, among those patients with data available, appear to be much higher than would be expected (given their body weight), at around 40 units/d.18 This contrasts with the ~20 units/d in the present study, and the doses in the BRIGHT trial,10 which followed the products' licenses (Gla‐300: 0.2 units/kg2 IDeg: 10 units3).
Although the results from the current study are consistent with data from the BRIGHT trial in insulin‐naïve adults with T2D10 and the three previous real‐world studies in insulin‐naïve or ‐experienced adults with T2D,8, 9, 17 there are some interesting differences between the insulin‐naïve studies. Firstly, patients in the current study had considerably higher mean baseline HbA1c values than those in the BRIGHT trial10 [9.7% vs. 8.6% (83 vs. 71 mmol/mol, respectively)]. This is probably because of the different HbA1c inclusion criteria [current study: 3–15% (<140 mmol/mol); BRIGHT: 7.5–10.5% (59–91 mmol/mol)] and because, in real‐world clinical practice, physicians often delay the initiation of insulin.19 However, patients in both cohorts of both studies achieved similar absolute HbA1c reductions (approximately −1.6%). Secondly, although patients in both cohorts in the current study achieved significant reductions in HbA1c (P < 0.0001), only 26% achieved HbA1c <7% (53 mmol/mol), which is considerably lower than was achieved in the BRIGHT trial population (47%10). Such discrepancies have previously been noted,20 probably because of better adherence in the context of an RCT,21 and this highlights the importance of data from real‐world studies to complement those from RCTs. The discrepancy in HbA1c attainment could also have been affected by the higher baseline HbA1c in the current study versus the BRIGHT trial [9.7% vs. 8.6% (83 vs. 71 mmol/mol, respectively)]. Also, because the basal insulin dose was titrated to a target fasting self‐monitored plasma glucose of 80–100 mg/dL in the BRIGHT trial,10 but dose increases in the current real‐world study would probably have been less intensive. Lastly, more patients in the current study achieved HbA1c <7% (53 mmol/mol) without hypoglycaemia (22%) than was achieved in the BRIGHT trial (13%10). Although this seems counterintuitive, it is probably a result of more hypoglycaemia events being captured in the BRIGHT trial (~68% of patients had any hypoglycaemia) because of more robust ascertainment of hypoglycaemia events in the context of an RCT.
4.1. Strengths and limitations
The real‐world DELIVER Naive D study provides information that complements the results from the BRIGHT trial.10 These results, from different study types and patient populations, provide useful information to healthcare‐delivery providers and clinicians on the effectiveness of two second‐generation basal insulin analogues. The strengths of this study include the application of propensity score matching, which ensured a good balance between the cohorts for the observable confounders, such as body mass index. Also, the study only included patients with complete data in the propensity score‐matching process to ensure that confounding was minimized for all endpoints (HbA1c and hypoglycaemia) under analysis. Lastly, sensitivity analyses confirmed the results from the main analyses.
However, there are some limitations to note, including the retrospective design and short, variable follow‐up. A variable follow‐up window of 3–6 months was chosen to allow for maximum inclusion of patients while maintaining sufficient follow‐up time to ensure that treatment effects on HbA1c could be reliably estimated. Diagnoses were based on ICD codes,12 but as EMR data may not link the actual diagnosis name, this could have resulted in some misclassifications. Furthermore, T2D duration data were not available, so this could not be included in the matching process. Also, the reasons for the choice of basal insulin were not available in the EMRs, so selection bias may not be completely excluded, even after propensity score matching. It should also be remembered that EMRs only capture the prescription, not dispensing or consumption, of drugs. As dosage data were missing in ~67% of the EMRs, detailed dose information could not be addressed in this study. However, we do not think that the absence of dose information from the patient matching process would have negatively affected the matching, as characteristics associated/correlated with dose were otherwise well matched (e.g. baseline HbA1c, body mass index, baseline concomitant medications).
Inpatient/ED hypoglycaemia should have been well captured in the EMR, but it is probable that many less serious events were not captured as there may not have been an accompanying healthcare claim. Lastly, although the study population represents a real‐life US adult T2D population, the results may not be generalizable to the whole US population, as only 4% of patients were from the West or Northeast regions.
4.2. Conclusions
Among previously insulin‐naïve adults with T2D, under real‐world circumstances, initiating Gla‐300 or IDeg improved glycaemic control to a similar extent and both second‐generation basal insulin analogues were associated with comparable levels of hypoglycaemia. These results from DELIVER Naive D complement the results from the first head‐to‐head RCT (BRIGHT trial) in insulin‐naïve adults.10 Moreover, they are fully consistent with data from other real‐world studies in insulin‐naïve or ‐experienced adults with T2D,8, 9, 16 which all suggest that the two longer‐acting basal insulins – Gla‐300 and IDeg – have comparable effects in terms of efficacy, effectiveness, and hypoglycaemia outcomes. Overall, the results of our study add to the growing body of evidence that suggests that second‐generation basal insulin analogues offer advantages over first‐generation basal insulin analogues, and that use of either of these second‐generation basal insulin analogues – Gla‐300 or IDeg – represents an effective option for patients with T2D starting insulin.
CONFLICT OF INTEREST
S.D.S. has served on the Advisory panel for and received research support from Boehringer Ingelheim and Sanofi. C.J.N., J.Wu, J.Westerbacka and Z.B. are employees of and stockholders in Sanofi. R.A.G. and A.A.M. are employees of Accenture, which was under contract with Sanofi. J.P.F. has received research support from AbbVie, Akcea, Allergan, AstraZeneca, Boehringer Ingelheim, BMS, Cirius, CymaBay, Elcelyx, Eli Lilly, Enanta, Genentech, IONIS, Intercept, Janssen, Johnson & Johnson, Lexicon, Ligand, Madrigal, Merck, Mylan, NGM, Novartis, Novo Nordisk, Pfizer, Sanofi and Theracos; has served on the advisory panel and received consultant's honoraria from AstraZeneca, Boehringer Ingelheim, Genentech, Gilead, Johnson and Johnson, Lilly, Merck, Novo Nordisk and Sanofi; and speaker's honoraria from Merck and Sanofi. T.S.B. has received research support from Abbott, Ascensia, BD, Boehringer Ingelheim, Calibra Medical, Capillary Biomedical, Companion Medical, Dance Biopharm, Dexcom, Diasome, Eli Lilly, Glysens, Kowa, Lexicon, Medtronic, Novo Nordisk, POPS! Diabetes Care, Sanofi, Senseonics, Taidoc, vTv Therapeutics, Xeris and Zealand; consultant's honoraria from Abbott, Capillary Biomedical, Eli Lilly, Medtronic, Novo Nordisk and Sanofi; and speaker's honoraria from Abbott, MannKind, Medtronic, Novo Nordisk, Sanofi and Senseonics.
AUTHOR CONTRIBUTIONS
C.J.N., R.A.G., A.A.M., J.Wu and J.Westerbacka designed the study. R.A.G. and A.A.M. acquired and analyzed the data. All authors contributed to the data interpretation, drafting, critical review, and revision of the manuscript.
Supporting information
APPENDIX S1 Baseline patient characteristics for all patients (pre‐match)
APPENDIX S2 Sensitivity analysis for ICD‐identified hypoglycaemia outcomes (with or without blood glucose ≤70 mg/dL) among matched patients. (A) Incidence during fixed 6‐month follow‐up (ITT). (B) Event rates during fixed 6‐month follow‐up (ITT). (C) Incidence and event rates during variable follow‐up (OT).
APPENDIX S3 Sensitivity analysis for hypoglycaemia outcomes identified by blood glucose ≤70 mg/dL (with or without an ICD code) among matched patients. (A) Incidence during fixed 6‐month follow‐up (ITT). (B) Event rates during fixed 6‐month follow‐up (ITT). (C) Incidence and event rates during variable follow‐up (OT).
ACKNOWLEDGMENTS
The authors received writing/editorial support from Yunyu Huang, PhD (Excerpta Medica) and Jenny Lloyd (Compass Medical Communications Ltd, on behalf of Excerpta Medica), funded by Sanofi.
Sullivan SD, Nicholls CJ, Gupta RA, et al. Comparable glycaemic control and hypoglycaemia in adults with type 2 diabetes after initiating insulin glargine 300 units/mL or insulin degludec: The DELIVER Naïve D real‐world study. Diabetes Obes Metab. 2019;21:2123–2132. 10.1111/dom.13793
Funding information This work was funded by Sanofi.
Peer Review The peer review history for this article is available at https://publons.com/publon/10.1111/dom.13793.
REFERENCES
- 1. American Diabetes Association (ADA) . 9. Pharmacologic approaches to glycemic treatment: standards of medical care in diabetes–2019. Diabetes Care. 2019;42(suppl 1):S90‐S102. [DOI] [PubMed] [Google Scholar]
- 2. Sanofi . Toujeo. http://products.sanofi.us/toujeo/toujeo.pdf. Accessed January 9, 2019.
- 3. Novo Nordisk . Tresiba. https://www.novo-pi.com/tresiba.pdf. Accessed January 9, 2019.
- 4. Heise T, Hermanski L, Nosek L, Feldman A, Rasmussen S, Haahr H. Insulin degludec: four times lower pharmacodynamic variability than insulin glargine under steady‐state conditions in type 1 diabetes. Diabetes Obes Metab. 2012;14:859‐864. [DOI] [PubMed] [Google Scholar]
- 5. Becker RH, Dahmen R, Bergmann K, Lehmann A, Jax T, Heise T. New insulin glargine 300 U·mL−1 provides a more even activity profile and prolonged glycemic control at steady state compared with insulin glargine 100 U·mL−1 . Diabetes Care. 2015;38:637‐643. [DOI] [PubMed] [Google Scholar]
- 6. Roussel R, Ritzel R, Boelle‐Le Corfec E, Balkau B, Rosenstock J. Clinical perspectives from the BEGIN and EDITION programmes: trial‐level meta‐analyses outcomes with either degludec or glargine 300U/mL vs glargine 100U/mL in T2DM. Diabetes Metab. 2018;44:402‐409. [DOI] [PubMed] [Google Scholar]
- 7. Bailey T, Zhou FL, Gupta RA, et al. Glycemic goal attainment and hypoglycemia outcomes in type 2 diabetes patients initiating insulin glargine 300 units/mL or 100 units/mL: real‐world results from the DELIVER naive cohort study. Diabetes Obes Metab. 2019. 10.1111/dom.13693 [published online ahead of print March 6, 2019]. [DOI] [PMC free article] [PubMed] [Google Scholar]
- 8. Blonde L, Zhou FL, Bosnyak Z, et al. Real‐world evidence demonstrates comparable clinical outcomes of switching from insulin glargine 100 U/mL (Gla‐100) to insulin glargine 300 U/mL (Gla‐300) vs insulin degludec (iDeg) in patients with type 2 diabetes (T2D). Poster presented at the 11th International Conference on Advanced Technologies & Treatments for Diabetes (ATTD), Vienna, Austria, February 14–17, 2018. https://simul‐europe.com/2018/attd/Files/(liz.zhou@sanofi.com)Blonde%20et%20al.%20ATTD%202018%20ePoster.pdf. Accessed December 20, 2018.
- 9. Sullivan SD, Bailey TS, Roussel R, et al. Clinical outcomes in real‐world patients with type 2 diabetes switching from first‐ to second‐generation basal insulin analogues: comparative effectiveness of insulin glargine 300 units/mL and insulin degludec in the DELIVER D+ cohort study. Diabetes Obes Metab. 2018;20:2148‐2158. [DOI] [PMC free article] [PubMed] [Google Scholar]
- 10. Rosenstock J, Cheng A, Ritzel R, et al. More similarities than differences testing insulin glargine 300 units/mL versus insulin degludec 100 units/mL in insulin‐naive type 2 diabetes: the randomized head‐to‐head BRIGHT trial. Diabetes Care. 2018;41:2147‐2154. [DOI] [PubMed] [Google Scholar]
- 11. IBM Watson Health . Technical Whitepaper. The Data Curation Process. 2016. https://www.ibm.com/downloads/cas/JBNOXQK4 [Google Scholar]
- 12. The American Association of Clinical Endocrinologists . Diabetes ICD‐9‐CM Crosswalk to ICD‐10‐CM. https://www.aace.com/files/socioeconomics/crosswalk/icd9-icd10-crosswalk-for-dm-2015.pdf. Accessed January 21, 2019.
- 13. Rosenbaum PR, Rubin DB. The central role of the propensity score in observational studies for causal effects. Biometrika. 1983;70:41‐55. [Google Scholar]
- 14. Austin PC. An introduction to propensity score methods for reducing the effects of confounding in observational studies. Multivariate Behav Res. 2011, 46:399‐424. [DOI] [PMC free article] [PubMed] [Google Scholar]
- 15. Quan H, Sundararajan V, Halfon P, et al. Coding algorithms for defining comorbidities in ICD‐9‐CM and ICD‐10 administrative data. Med Care. 2005;43:1130‐1139. [DOI] [PubMed] [Google Scholar]
- 16. Pettus J, Roussel R, Liz Zhou F, et al. Rates of hypoglycemia predicted in patients with type 2 diabetes on insulin glargine 300 U/ml versus first‐ and second‐generation basal insulin analogs: the real‐world LIGHTNING study. Diabetes Ther. 2019;10:617‐633. [DOI] [PMC free article] [PubMed] [Google Scholar]
- 17. Tibaldi J, Hadley‐Brown M, Liebl A, et al. A comparative effectiveness study of degludec and insulin glargine 300U/mL in insulin‐naive patients with type 2 diabetes. Diabetes Obes Metab. 2018. 10.1111/dom.136162018 [published online ahead of print December 15, 2018]. [DOI] [PMC free article] [PubMed] [Google Scholar]
- 18. Tibaldi J, Haldrup S, Sandberg V, et al. Clinical outcome assessment of the effectiveness of insulin degludec in real‐life medical practice (CONFIRM): a comparative effectiveness study of degludec and insulin glargine 300 units/mL in insulin‐naive patients with type 2 diabetes. Poster presented at the 78th Annual Scientific Sessions of the American Diabetes Association (ADA), Orlando, FL, USA; June 22–26, 2018. https://ada.scientificposters.com/epsAbstractADA.cfm?id=1. Accessed January 9, 2019.
- 19. Khunti K, Wolden ML, Thorsted BL, Andersen M, Davies MJ. Clinical inertia in people with type 2 diabetes: a retrospective cohort study of more than 80,000 people. Diabetes Care. 2013;36:3411‐3417. [DOI] [PMC free article] [PubMed] [Google Scholar]
- 20. Blonde L, Brunton SA, Chava P, et al. Achievement of target A1C <7.0% (<53 mmol/mol) by U.S. type 2 diabetes patients treated with basal insulin in both randomized controlled trials and clinical practice. Diabetes Spectrum. 10.2337/ds17-0082. [published online ahead of print October 17, 2018]. [DOI] [PMC free article] [PubMed] [Google Scholar]
- 21. Edelman SV, Polonsky WH. Type 2 diabetes in the real world: the elusive nature of glycemic control. Diabetes Care. 2017;40:1425‐1432. [DOI] [PubMed] [Google Scholar]
Associated Data
This section collects any data citations, data availability statements, or supplementary materials included in this article.
Supplementary Materials
APPENDIX S1 Baseline patient characteristics for all patients (pre‐match)
APPENDIX S2 Sensitivity analysis for ICD‐identified hypoglycaemia outcomes (with or without blood glucose ≤70 mg/dL) among matched patients. (A) Incidence during fixed 6‐month follow‐up (ITT). (B) Event rates during fixed 6‐month follow‐up (ITT). (C) Incidence and event rates during variable follow‐up (OT).
APPENDIX S3 Sensitivity analysis for hypoglycaemia outcomes identified by blood glucose ≤70 mg/dL (with or without an ICD code) among matched patients. (A) Incidence during fixed 6‐month follow‐up (ITT). (B) Event rates during fixed 6‐month follow‐up (ITT). (C) Incidence and event rates during variable follow‐up (OT).