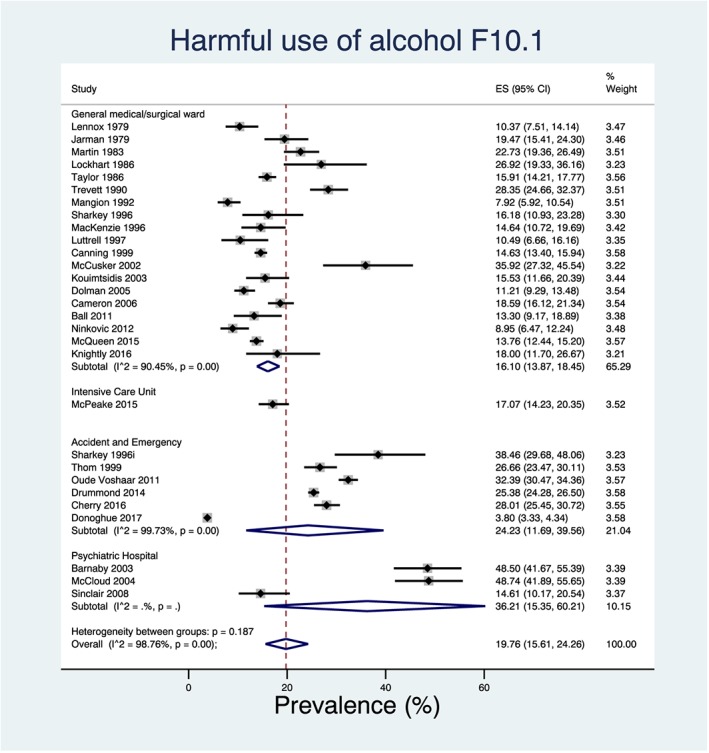
Figure 3.

Forest plot of the pooled prevalence for harmful use of alcohol in non‐selective in‐patients in the UK hospital system stratified by setting and ordered by the year in which the study was conducted. [Colour figure can be viewed at wileyonlinelibrary.com]
