
Figure 2.
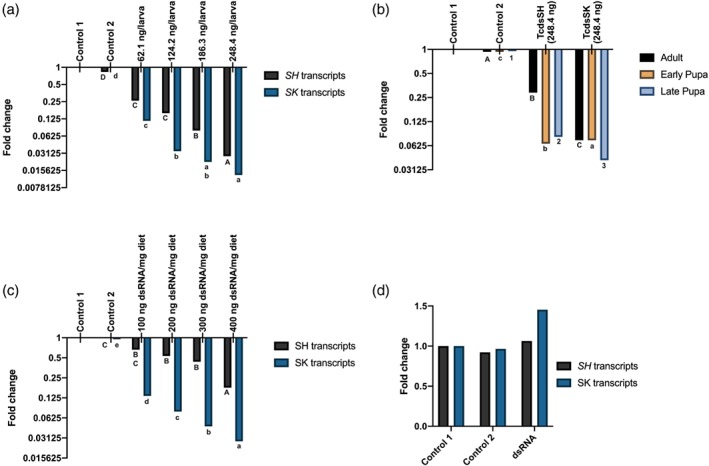
(a) Expression of SK and SH in larvae injected with dsRNA after 48 h. Control 1, larvae injected with RNAase free water; control 2, larvae injected with dsKana. Expression levels were normalized against the TTcRpS6 gene as an internal standard. n = 5; mean of replications is shown. Means with different letters are significantly different (P < 0.05, one‐way ANOVA, post‐hoc Tukey test) within each gene set. (b) Expression of SK and SH in early‐ and late‐stage pupae and adults injected with dsRNA after 48 h. Control 1, larvae injected with RNAase free water; control 2, larvae injected with dsKana. Expression levels were normalized against the TcRpS6 gene as an internal standard. n = 5; mean of replications is shown. Means with different letters are significantly different (P < 0.05, one‐way ANOVA, post‐hoc Tukey test) within each gene set.(c) Expression of SK and SH in larvae fed with dsRNA after 72 h. Control 1, larvae injected with RNAase free water; control 2, larvae injected with dsKana. Expression levels were normalized against the TcRpS6 gene as an internal standard. n = 5; mean of replications is shown. Means with different letters are significantly different (P < 0.05, one‐way ANOVA, post‐hoc Tukey test) within each gene set. (d) Expression of SK and SH in foraging honeybees A. mellifera fed TcdsRNA after 72 h. Treatments, foragers fed 50% sucrose containing 20 ng μL−1 TcdsSK or TcdsSH; control 1, foragers fed 50% sucrose; control 2, foragers fed 50% sucrose containing 20 ng μL−1 bacterial dsKana,. Expression levels were normalised against the β‐actin gene as an internal standard. Mean of replications are shown. Means with different letters are significantly different in the expression levels of the target gene (P < 0.05, one‐way ANOVA, post‐hoc Tukey test).