
Figure 2.
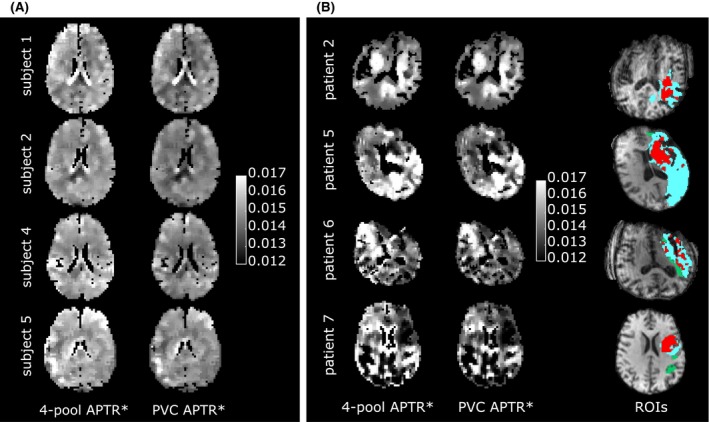
A, Healthy subject maps, and B, representative patient maps using 4‐pool and PVC models. Red: ischemic core, green: oligaemia, cyan: infarct growth
Official websites use .gov
A
.gov website belongs to an official
government organization in the United States.
Secure .gov websites use HTTPS
A lock (
) or https:// means you've safely
connected to the .gov website. Share sensitive
information only on official, secure websites.
A, Healthy subject maps, and B, representative patient maps using 4‐pool and PVC models. Red: ischemic core, green: oligaemia, cyan: infarct growth