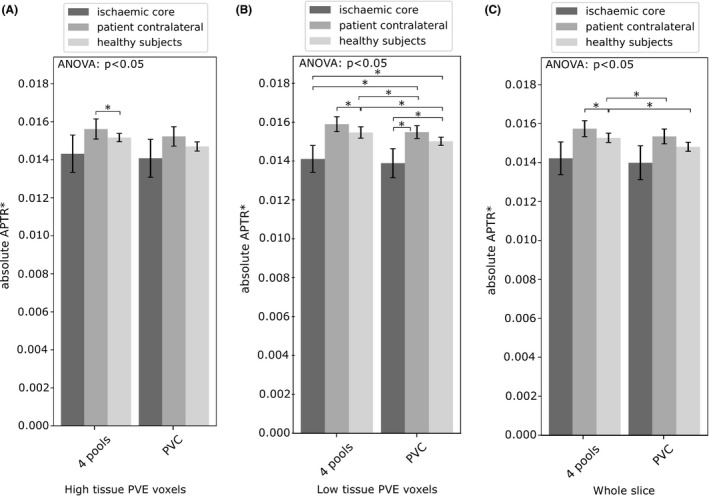
Figure 3.

Subject mean absolute using the 4‐pool and PVC measures, shown for A voxels with a high tissue PVE, B voxels with a low tissue PVE, and C the whole slice. Error bars are the 95% CI. Statistical significance between ROIs is denoted by an asterisk. Significant results using the same ROI are highlighted with a solid line
