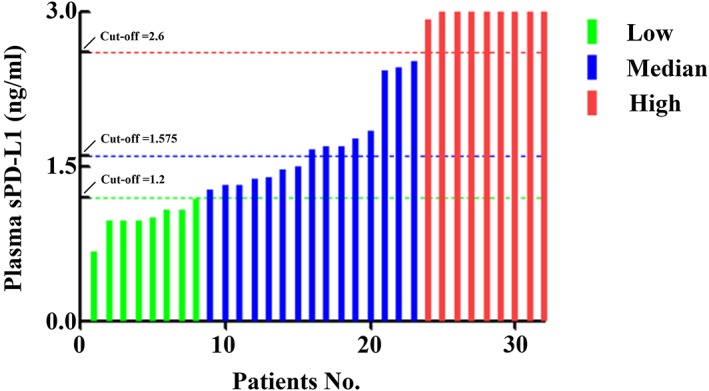
Figure 4.

Three cohorts of PTCL patients with low (green), median (blue), and high (red) sPD‐L1 level. The threshold of cut‐off values between low and median cohorts was 1.2, and the threshold of cut‐off values between median and high cohorts was 2.6. The optimal cut‐off value was 1.575
