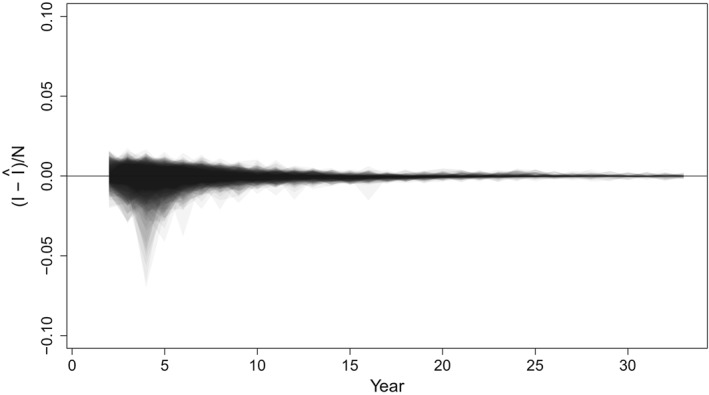
Figure 7.

Normalized prediction intervals over 33 years of data from 100 simulations from the SIR model simulated data sets. The y‐axis reflects the true incidence, minus the predicted incidence, as a fraction of population size to remove trends in individual time series. Shaded regions including the zero line indicate that the prediction interval captures the true value
