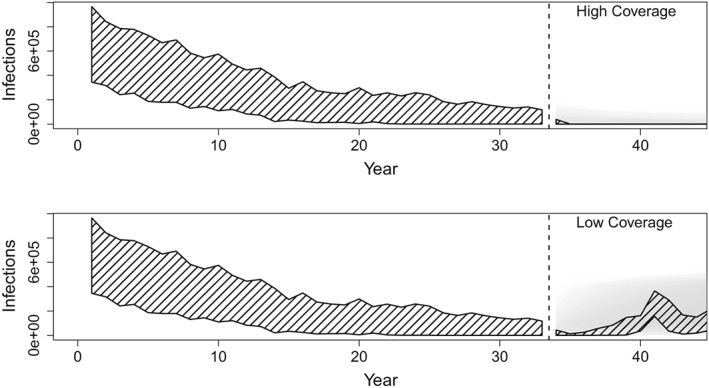
Figure 8.

Infections, which are the total number of measles cases, are shown across years. Forward predictions of the unobserved number of infections from fitted model for the optimistic (top) and pessimistic (bottom) future vaccination scenarios. Hatched shading illustrates the central 95% of simulated incidence for 33 years of observed data (left of dashed line) and 15 years of future simulation (right of dashed line) from 100 simulations. Gray shading illustrates the central 95% of the prediction interval for 15 years of forward prediction for each of the 100 fitted models. Darker shading indicates higher density of predicted incidence
