Figure 2:

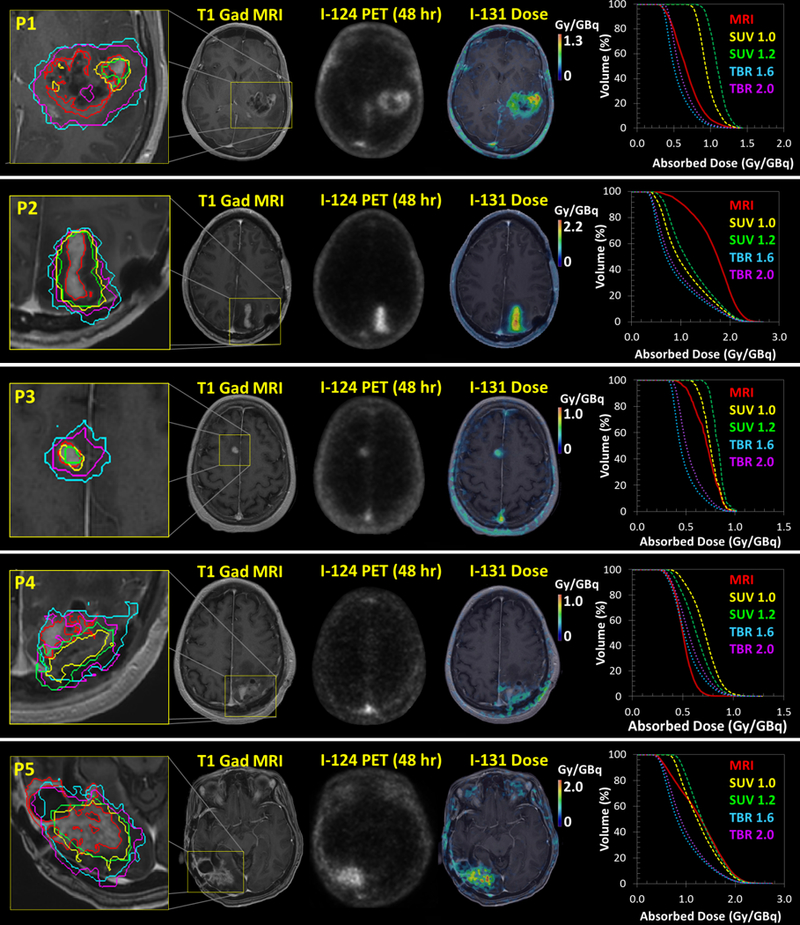
The MRI, 48 hr post injection 124I-CLR1404 PET, and 131I-CLR1404 dose distributions for each patient. The MRI, SUV, and TBR threshold-based tumor contours and the resulting DVHs are also shown.

The MRI, 48 hr post injection 124I-CLR1404 PET, and 131I-CLR1404 dose distributions for each patient. The MRI, SUV, and TBR threshold-based tumor contours and the resulting DVHs are also shown.