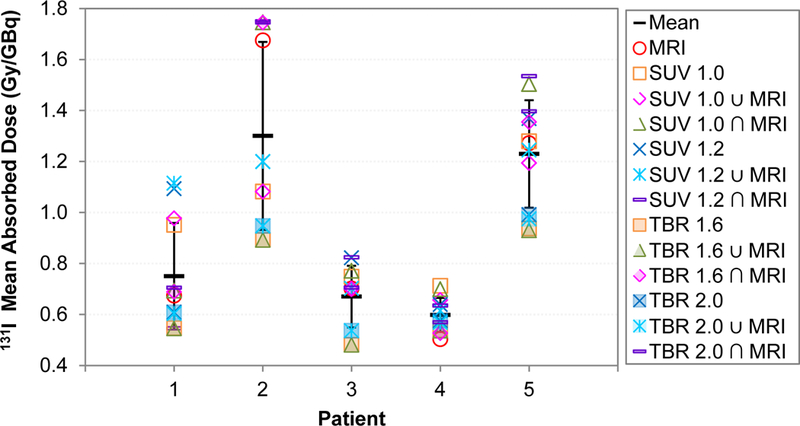
Figure 4:

Mean tumor doses for each patient. The error bars represent the standard deviation. Note that the larger TBR contours (filled markers) generally had smaller mean doses and the smaller SUV contours (unfilled markers) generally had larger mean doses
