Figure 5:

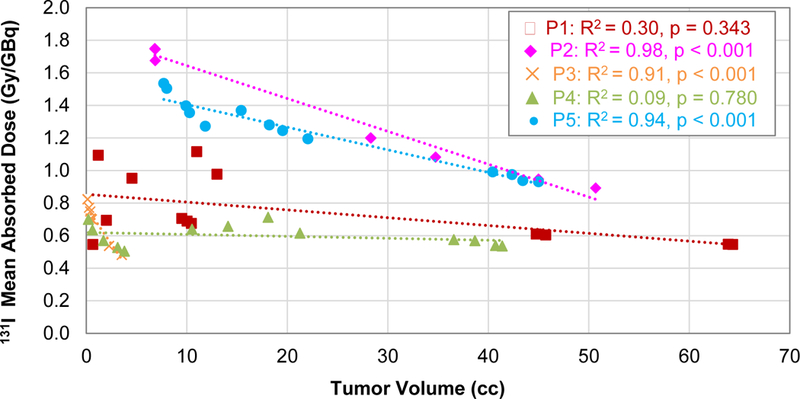
Correlation between the mean tumor dose and the tumor contour volumes for each patient. The Pearson correlation coefficient (R2) and p-values of the linear correlation are also shown.

Correlation between the mean tumor dose and the tumor contour volumes for each patient. The Pearson correlation coefficient (R2) and p-values of the linear correlation are also shown.