
Fig. 5.
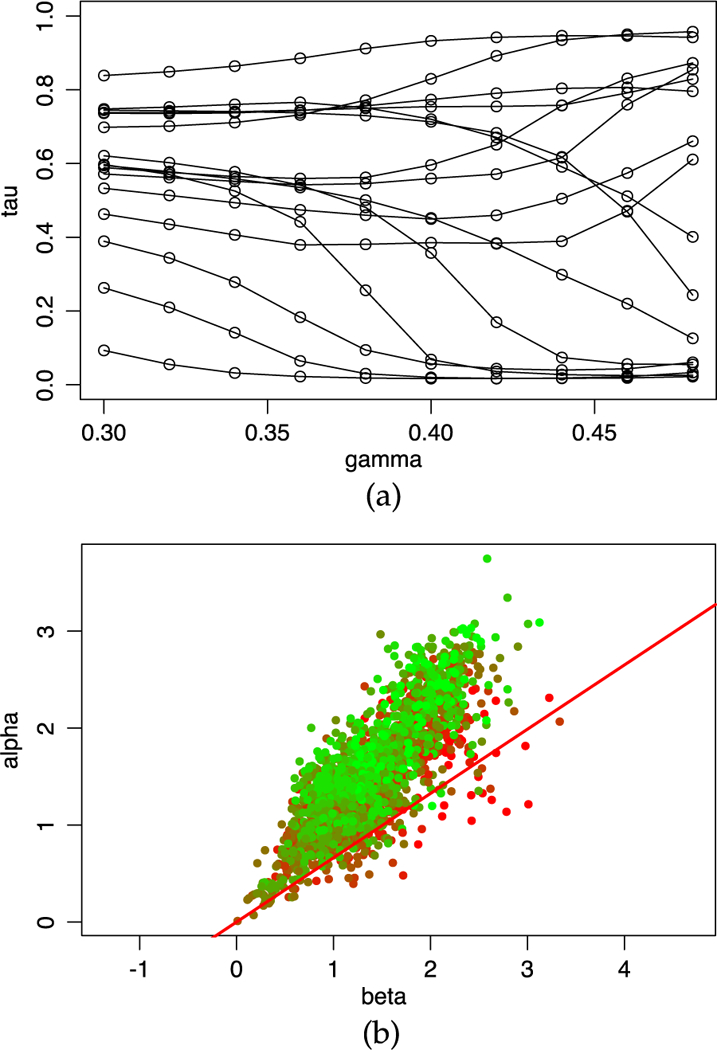
(a) Reliability scores versus γ ∈ [0.3,0.48] for the top 15 users who provided the most numbers of ratings. (b) Visualization of the estimated regularity parameters of each worker at a given γ. Green dots are for workers with high reliability and red dots for low reliability. The slope of the red line equals γ.