
Figure 1.
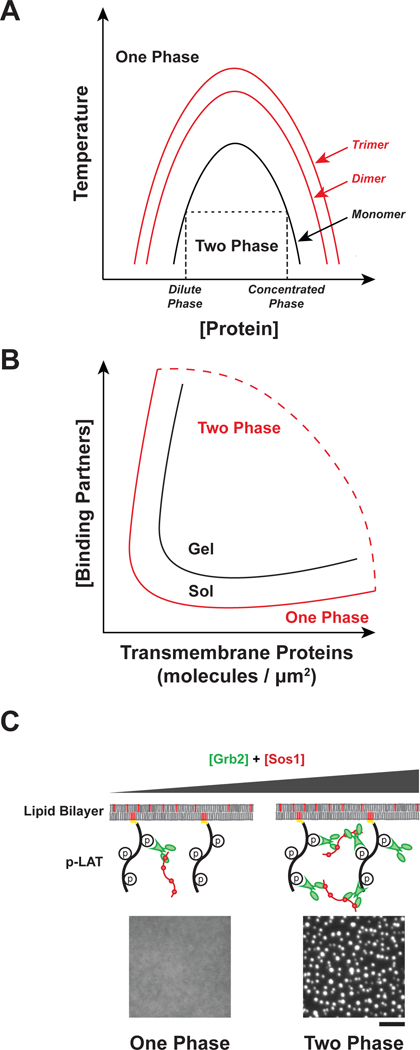
Regulation of sol-gel transition and phase separation. A) Oligomerization promotes phase separation. Phase diagram as a function of protein concentration and temperature for monomeric proteins (black line) or oligomers (red lines). Changes to temperature, pH, salt concentration, or crowding can also alter the shape of the binodal curve of the system. At low concentrations, molecules exist in a single dilute phase (One Phase). As concentration increases molecules separate into a dilute phase and a concentrated phase (Two Phase). At high concentrations, molecules exist in a single concentrated phase (One Phase). Phase separation is promoted by increasing the concentration of cytosolic binding partners. B) Phase diagram as a function of transmembrane protein density and cytosolic binding partner concentration. The binodal curve of the sol-gel transition (black) and the phase separation (red) represent distinct physical processes. C) Representative images showing in vitro phase separation of phospho-LAT, Grb2, and Sos1 on membranes. At low Grb2 and Sos1 concentrations the proteins exist in one dilute phase, but at higher concentrations phase separation occurs. Scale bar = 5 μm.