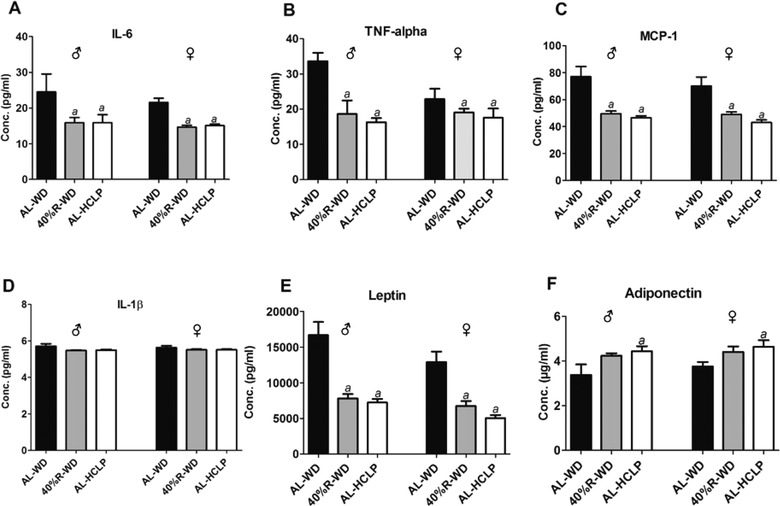
Figure 4.

Impact of the different diets on the levels of inflammatory cytokines in plasma. The animals were either fed continuously with the AL‐WD or for 5 weeks with a 40%‐R‐WD or with the AL‐HCLP. Bars indicate mean ± SD that were obtained from six animals per group. (a) indicates statistical significance (p ≤ 0.05, Bonferroni's method).
