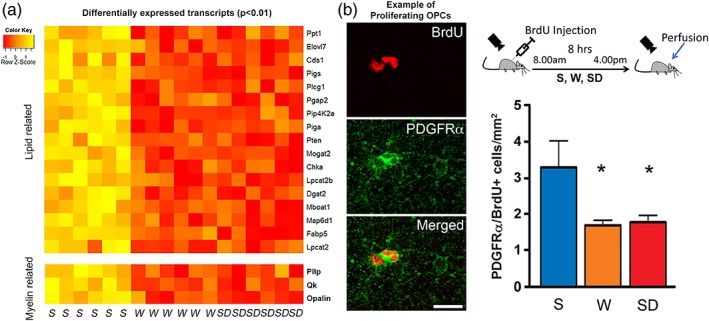
Figure 1.

Sleep and myelin. (a). Heat diagram showing the expression intensity of differentially expressed transcripts of oligodendrocyte‐enriched forebrain samples of sleeping (S), awake (W), sleep deprived (SD). (b). Left, example of proliferating OPCs stained by the specific marker PDGFRα (green) and positive for BrdU (red). Scale bar: 15 μm. Right, scheme describing the experiment design (top) and quantification of proliferating OPCs in the cerebral cortex of mice after 8 hr of S, W, and SD (bottom). Adapted from Bellesi et al., 2013, 2015
