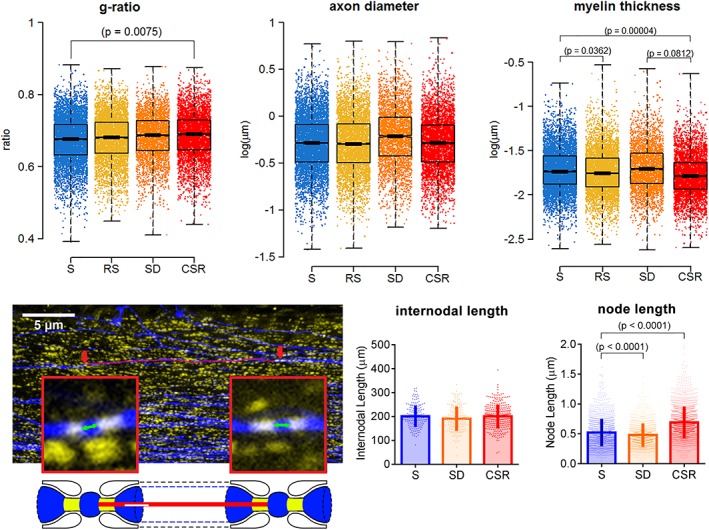
Figure 2.

Myelin changes after chronic sleep loss. Top row: Distribution of g‐ratio, axon diameter, and myelin thickness measurements in adolescent mice after sleep (S), acute sleep deprivation (SD), chronic sleep restriction (CSR: ~5 days), recovery sleep (RS: 32 hr after the end of ~5 days of CSR). For axon diameter and myelin thickness, a log transformation has been applied to raw values, so the units are log(μm). Bottom row: Representative corpus callosum coronal section at the level of the decussation of the anterior commissure (+0.14 mm a/P from bregma) depicting YFP+ fibers (blue) and CASPR+ puncta (yellow). Red arrows indicate examples of nodes considered for the internodal length analysis, which are shown at larger magnification in the squared boxes. The red line along the axon indicates the internodal length, while the green arrows indicate node length. In the bottom scheme, representative nodes of Ranvier with paranodal sites (yellow) and the red line representing the internodal length are depicted. Graphs indicate distribution of internodal and node lengths values from the corpus callosum of S (n = 4 mice, 173 internodes and 1,412 nodes), SD (n = 4 mice, 180 internodes and 1,310 nodes), and CSR (n = 7 mice, 316 internodes and 2006 nodes) mice. Note that node length has been estimated as the shortest distance between two closely apposed CASPR+ puncta along the YFP+ axon. Data were analysed with ANOVA followed by Bonferroni's post hoc test. Adapted from Bellesi et al., 2018
